NexusFi: Find Your Edge


Home Menu


Applying Fibonacci Cluster and Confluence Zones


Discussion in NinjaTrader

Updated
      Top Posters
    1. looks_one Fat Tails with 72 posts (256 thanks)
    2. looks_two Daytrader50 with 10 posts (3 thanks)
    3. looks_3 Silvester17 with 9 posts (0 thanks)
    4. looks_4 fireman912 with 8 posts (14 thanks)
      Best Posters
    1. looks_one websouth with 10 thanks per post
    2. looks_two Fat Tails with 3.6 thanks per post
    3. looks_3 Pietvw with 2.7 thanks per post
    4. looks_4 fireman912 with 1.8 thanks per post
    1. trending_up 116,207 views
    2. thumb_up 326 thanks given
    3. group 84 followers
    1. forum 182 posts
    2. attach_file 103 attachments


Search this Thread

Applying Fibonacci Cluster and Confluence Zones

  #81 (permalink)
 
Fat Tails's Avatar
 Fat Tails 
Berlin, Europe
Market Wizard
 
Experience: Advanced
Platform: NinjaTrader, MultiCharts
Broker: Interactive Brokers
Trading: Keyboard
Posts: 9,888 since Mar 2010
Thanks Given: 4,242
Thanks Received: 27,103


matthew1182 View Post
This is a great indicator brother! I use a Fractal Pivot Confluence indicator. I was actually looking for the NEXGEN Fibonacci Confluence indicator but stumbled upon yours. Now if we could somehow combine yours with what I have I think we would have the ultimate pivot indicator.

Check out some screen shots.


This is the simple version of the indicator, I mainly use the confluence indicator, as it plots fewer lines. Fewer occasions to trade, but higher probability trades.

Started this thread Reply With Quote
Thanked by:

Can you help answer these questions
from other members on NexusFi?
MC PL editor upgrade
MultiCharts
Pivot Indicator like the old SwingTemp by Big Mike
NinjaTrader
REcommedations for programming help
Sierra Chart
What broker to use for trading palladium futures
Commodities
ZombieSqueeze
Platforms and Indicators
 
  #82 (permalink)
 matthew1182 
Tampa, FL, USA
 
Experience: Intermediate
Platform: NinjaTrader
Trading: EUR/JPY
Posts: 7 since Sep 2010
Thanks Given: 21
Thanks Received: 2


Fat Tails View Post
This is the simple version of the indicator, I mainly use the confluence indicator, as it plots fewer lines. Fewer occasions to trade, but higher probability trades.

Newbie to Ninja but I don't believe there is a confluence indicator in the package that you loaded?? I don't see an "alpha" indicator?

Reply With Quote
  #83 (permalink)
 
Fat Tails's Avatar
 Fat Tails 
Berlin, Europe
Market Wizard
 
Experience: Advanced
Platform: NinjaTrader, MultiCharts
Broker: Interactive Brokers
Trading: Keyboard
Posts: 9,888 since Mar 2010
Thanks Given: 4,242
Thanks Received: 27,103


matthew1182 View Post
Newbie to Ninja but I don't believe there is a confluence indicator in the package that you loaded?? I don't see an "alpha" indicator?


No, I have not put the confluence zones indicator in the download section. If you want to try it, send me a private message.

Started this thread Reply With Quote
  #84 (permalink)
 
trendisyourfriend's Avatar
 trendisyourfriend 
Quebec Canada
Market Wizard
 
Experience: Intermediate
Platform: NinjaTrader
Broker: AMP/CQG
Trading: ES, NQ, YM
Frequency: Daily
Duration: Minutes
Posts: 4,527 since Oct 2009
Thanks Given: 4,176
Thanks Received: 6,020


Fat Tails View Post
No, I have not put the confluence zones indicator in the download section. If you want to try it, send me a private message.


Fat, i tried to run the version i had for NT6.5 but to no avail. Did you desactivate it ?

Reply With Quote
  #85 (permalink)
 
Fat Tails's Avatar
 Fat Tails 
Berlin, Europe
Market Wizard
 
Experience: Advanced
Platform: NinjaTrader, MultiCharts
Broker: Interactive Brokers
Trading: Keyboard
Posts: 9,888 since Mar 2010
Thanks Given: 4,242
Thanks Received: 27,103


trendisyourfriend View Post
Fat, i tried to run the version i had for NT6.5 but to no avail. Did you desactivate it ?

Should be active. Did your Machine-ID change? Send me a private mail, and we can check it.

Started this thread Reply With Quote
  #86 (permalink)
 
Lejcus's Avatar
 Lejcus 
Czech Republic
 
Experience: Intermediate
Platform: NinjaTrader
Broker: Ninja/ Continuum
Trading: Anything that move
Posts: 43 since Apr 2010
Thanks Given: 216
Thanks Received: 66

Thank for sharing your knowledge.
I Just found Fibo Clusters two days ago. They fit my style of trading. I try to combine more method of S/R (swings HLC MP PIVOTS vPoC simple fibonacci from past day) and where they fit together they become more valid for me. I would like to use cluster too but still dont know how properly get the confluence zone from the cluster. For me there is too many lines and thats it

Reply With Quote
  #87 (permalink)
 
Fat Tails's Avatar
 Fat Tails 
Berlin, Europe
Market Wizard
 
Experience: Advanced
Platform: NinjaTrader, MultiCharts
Broker: Interactive Brokers
Trading: Keyboard
Posts: 9,888 since Mar 2010
Thanks Given: 4,242
Thanks Received: 27,103


Lejcus View Post
Thank for sharing your knowledge.
I Just found Fibo Clusters two days ago. They fit my style of trading. I try to combine more method of S/R (swings HLC MP PIVOTS vPoC simple fibonacci from past day) and where they fit together they become more valid for me. I would like to use cluster too but still dont know how properly get the confluence zone from the cluster. For me there is too many lines and thats it

The fib cluster indicator does not display confluence zones, but it displays single lines. If you are just interested in yesterday's fibs, you may just display the Z lines, which are the most recent lines of the indicator. The different letters of the alphabet are used to identify different swings to calculate the retracements and expansions. The largest swing identified by the indicator is the A swing, the smallest swing is the Z swing, which relates to yesterday's and today's price action. I attach a screenshot of indicator settings for the FibClusterV14 and a chart below.


For intraday price action you can also download the CurrentDayOHL indicator (part of the SessionPivots V29 package). It shows Fib retracements calculated from today's high and low. Shown on second chart below.


If you want confluence zones displayed, you would need to use the FibZones indicator. Shown on third chart below.

Attached Thumbnails
Click image for larger version

Name:	Indicator Dialogue.JPG
Views:	404
Size:	75.1 KB
ID:	23717   Click image for larger version

Name:	ES 12-10 (15 Min)  21_10_2010.jpg
Views:	453
Size:	110.4 KB
ID:	23719   Click image for larger version

Name:	ES 12-10 (5 Min)  21_10_2010.jpg
Views:	347
Size:	93.5 KB
ID:	23723   Click image for larger version

Name:	ES 12-10 (5 Min)  21_10_2010 bis.jpg
Views:	412
Size:	90.7 KB
ID:	23725  
Started this thread Reply With Quote
Thanked by:
  #88 (permalink)
 
gr8trim4u's Avatar
 gr8trim4u 
Northern VA
 
Experience: Intermediate
Platform: TS
Broker: TS
Trading: E mini/Currency Futures
Posts: 3 since Jan 2011
Thanks Given: 0
Thanks Received: 3

Attachment 28090
trendisyourfriend View Post
I think these analysis (which are very impressive i must admit) should be presented in a true context, ie, if they have some predictive value then they should predict the next day price action not what has occured. I have not seen anything to this effect so far.

Scott Carney's books the harmonic trader wil offer some insight into building the right side of the chart. Jeff manson whose work is not published at this point has done extensive work in prior price movement dictating future price. I sat through some of his training. The following are price movement anticipated from prior movements. An understanding of Elliot will help out a little also. After reading this thread I will definitly incorparate a few other indicators.

Attached Thumbnails
Applying Fibonacci Cluster and Confluence Zones-chief-architect-x1-fibs-work-book.pdf  
Reply With Quote
Thanked by:
  #89 (permalink)
 
cory's Avatar
 cory 
virginia
 
Experience: Intermediate
Platform: ninja
Trading: NQ
Posts: 6,098 since Jun 2009
Thanks Given: 877
Thanks Received: 8,090

Larry P. just posted this one

Attached Thumbnails
Click image for larger version

Name:	clip_image002_018.jpg
Views:	347
Size:	32.6 KB
ID:	28093   Click image for larger version

Name:	clip_image002_021.jpg
Views:	319
Size:	35.3 KB
ID:	28094  
Reply With Quote
Thanked by:
  #90 (permalink)
 
Fat Tails's Avatar
 Fat Tails 
Berlin, Europe
Market Wizard
 
Experience: Advanced
Platform: NinjaTrader, MultiCharts
Broker: Interactive Brokers
Trading: Keyboard
Posts: 9,888 since Mar 2010
Thanks Given: 4,242
Thanks Received: 27,103


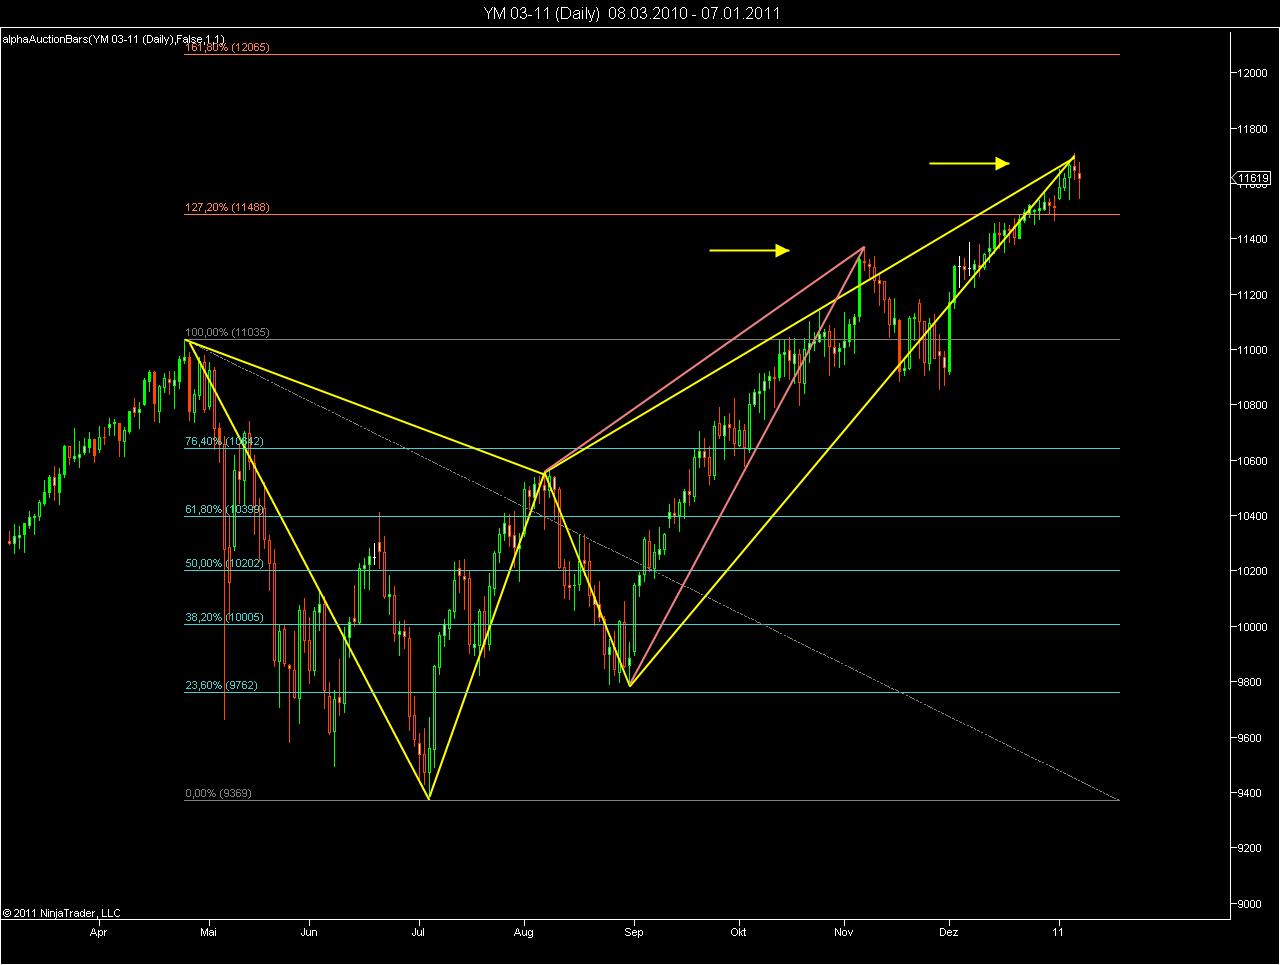
The problem with Butterfly patterns is that you do not really know, when the pattern will complete. Some of them have an expansion smaller than 1.272, others approach 1.618


Started this thread Reply With Quote


Last Updated on August 15, 2017


© 2024 NexusFi™, s.a., All Rights Reserved.
Av Ricardo J. Alfaro, Century Tower, Panama City, Panama, Ph: +507 833-9432 (Panama and Intl), +1 888-312-3001 (USA and Canada)
All information is for educational use only and is not investment advice. There is a substantial risk of loss in trading commodity futures, stocks, options and foreign exchange products. Past performance is not indicative of future results.
About Us - Contact Us - Site Rules, Acceptable Use, and Terms and Conditions - Privacy Policy - Downloads - Top
no new posts