|
Asia
Experience: Beginner
Platform: InvestorRT, Ninjatrader
Broker: Zen-Fire
Trading: Bongos
Posts: 22 since Jan 2010
Thanks Given: 37
Thanks Received: 25
|
Any help from NT experts much appreciated, as I can't seem to find an answer to this issue. 
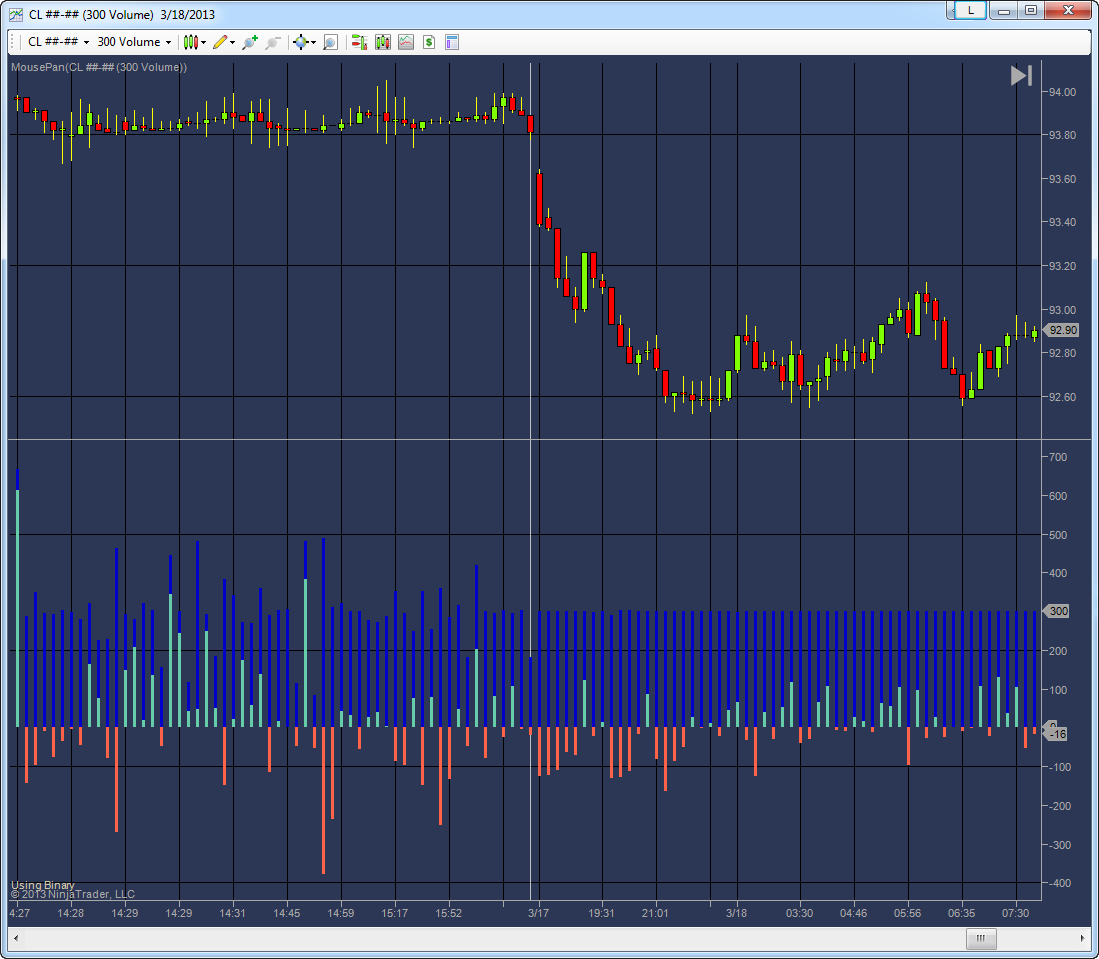
I use constant volume bar charts and they are plotting perfectly on NT with a live feed. But when I use downloaded tick data, NT starts plotting the bars strangely, i.e. the bars all start looking like dojis and there are more of them than there should be (I know because crosschecked against Market Delta). I also notice that the total volume bars on the GOM delta volume indicator are uneven with historical tick data, and they should not be (given these are constant volume charts).
What am I missing? I am downloading both tick data for GOM using the excellent BaBAR and tick data for NT. I use IQfeeed.
I've attached a picture showing volume bars using historical data on the left and live feed on the right. Thanks in advance.
|


