Welcome to NexusFi: the best trading community on the planet, with over 150,000 members Sign Up Now for Free
Genuine reviews from real traders, not fake reviews from stealth vendors
Quality education from leading professional traders
We are a friendly, helpful, and positive community
We do not tolerate rude behavior, trolling, or vendors advertising in posts
We are here to help, just let us know what you need
You'll need to register in order to view the content of the threads and start contributing to our community. It's free for basic access, or support us by becoming an Elite Member -- see if you qualify for a discount below.
-- Big Mike, Site Administrator
(If you already have an account, login at the top of the page)
I hate to bother anyone but i was wondering if anyone may know how to code the following for Ninja 7:
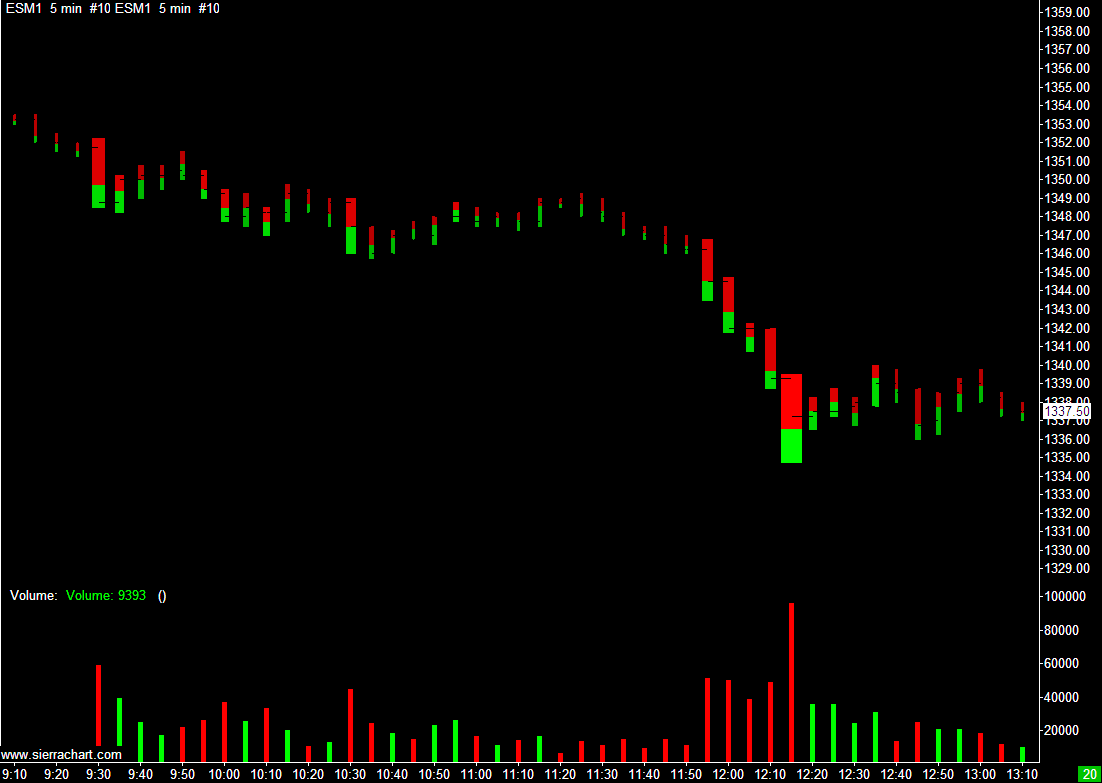
what i was thinking about was a chart bar to have the net volume for that bar running inside of it. for instance if a bar (5 min, 150 tick, 5 range or whatever time frame you would use) had a net minus 50 voume for the bar it would graph it according with the level being shaded in red or whatever color and have the net amount in the bar. or if the bar had a net plus 50 for the bar it would graph it according with the level being shaded blue or whatever color. this would be a live bar and the bar would be either filling up with red or blue to determine the acitivity on how the level is being processed. it would also have the pricing regular bars going on also. i have attached a screen shothttps://screencast.com/t/oaTW8VpRFN.
thanks
hector
Can you help answer these questions from other members on NexusFi?
Isn't this known as Equivolume bars, or something like this... I've seen it before, someone has written it for NT already -- the width of the bar is determined by the volume of the bar.
Yes, but the shading in Equivolume bars relates to the close of the bar. The shading in TFlow bars reflects the bid/ask volume of the bar. If I understood correctly, that was what the OP was after.
Thanks everyone for responding. I have attached another example of what I visioning.
What I was looking for was:
1. An outlined candle with wicks.
2. Insided the candle it will be changing color with red or blue depending on the current net fo the volume
for that bar at that time. Almost like a bucket being filled up with water but only it would be volume.
3. Inside or below the bar it would give a small running net amount at that time. Plus for buys and minus for
sells. I guess one would have to figure out on the volume which is the ask trades and which are the bid
trades.
4. When the bar closes it would then show the final out come. The bar would be filled blue for plus net volume
or red for negative net volume. On the bottom of the bar or inside it would show the amount by which it
was net.
I think this could help out when a reversal may be coming, slowing down or changing in net volume pertaining to buyers and sellers. Anyways hopefully this can be done.
Here is the example I was talking about bar2 close - hector24's library