Welcome to NexusFi: the best trading community on the planet, with over 150,000 members Sign Up Now for Free
Genuine reviews from real traders, not fake reviews from stealth vendors
Quality education from leading professional traders
We are a friendly, helpful, and positive community
We do not tolerate rude behavior, trolling, or vendors advertising in posts
We are here to help, just let us know what you need
You'll need to register in order to view the content of the threads and start contributing to our community. It's free for basic access, or support us by becoming an Elite Member -- see if you qualify for a discount below.
-- Big Mike, Site Administrator
(If you already have an account, login at the top of the page)
Just became a member and was wondering if someone could help me out. I wanted to know if someone could create an indicator for me. I'm looking for it to draw in an hourly time frame inside bar(trend lines) on a 5 minute chart. What I mean is
when an hour of time has passed(4:00am,5:00am,6:00am,ect) I want it to find the high and low of that time span.
Then the next hour of time (on a 5 minute chart) I want to find the high and low again.
if the first hours high is higher than the second hours high && the first hours low is lower than the second hours low that would form an inside bar(on hourly time frame).
At that point a ray or extended line is drawn from the first hours high(higher high) to the second hours high(lower high) and a ray or extended line is drawn from the first hours low(lower low) to the second hours low(higher low) forming a triangle.
At this point nothing should change until it has happened again
Example: If the next hour forms an inside bar in reference to the second hours span in above description then that would now be the new highs and lows or reference points for extended lines.
If not then as stated before nothing would happen until a new set of hour time spans meet this criteria.
"Each set of 2 hours is its own" meaning if an hour time span happened at 9:00am an hourly inside bar at 11:00am would not be a match. They need to be consecutive hourly time spans forming the inside bar on the hourly time frame.
Once again I want this to be drawn on the 5 minute chart automatically - only using the hourly time spans as reference points for the trend line.
Also as stated once the criteria is met for a new set of upper and lower trend lines is met then the previous trend lines are erased and replaced with the new trend lines.
Thanks
Chris
Can you help answer these questions from other members on NexusFi?
Exported using NinjaTrader 7.0.1000.8
This is a simple indicator that allows to display larger timeframe candles on any chart. For example you can display 30 min or 60 min candles on a 5 min chart.
The larger timeframe candles are plotted behind …
@Tradingfutures: Welcome to the forum, for your first post this is a rather complex idea!
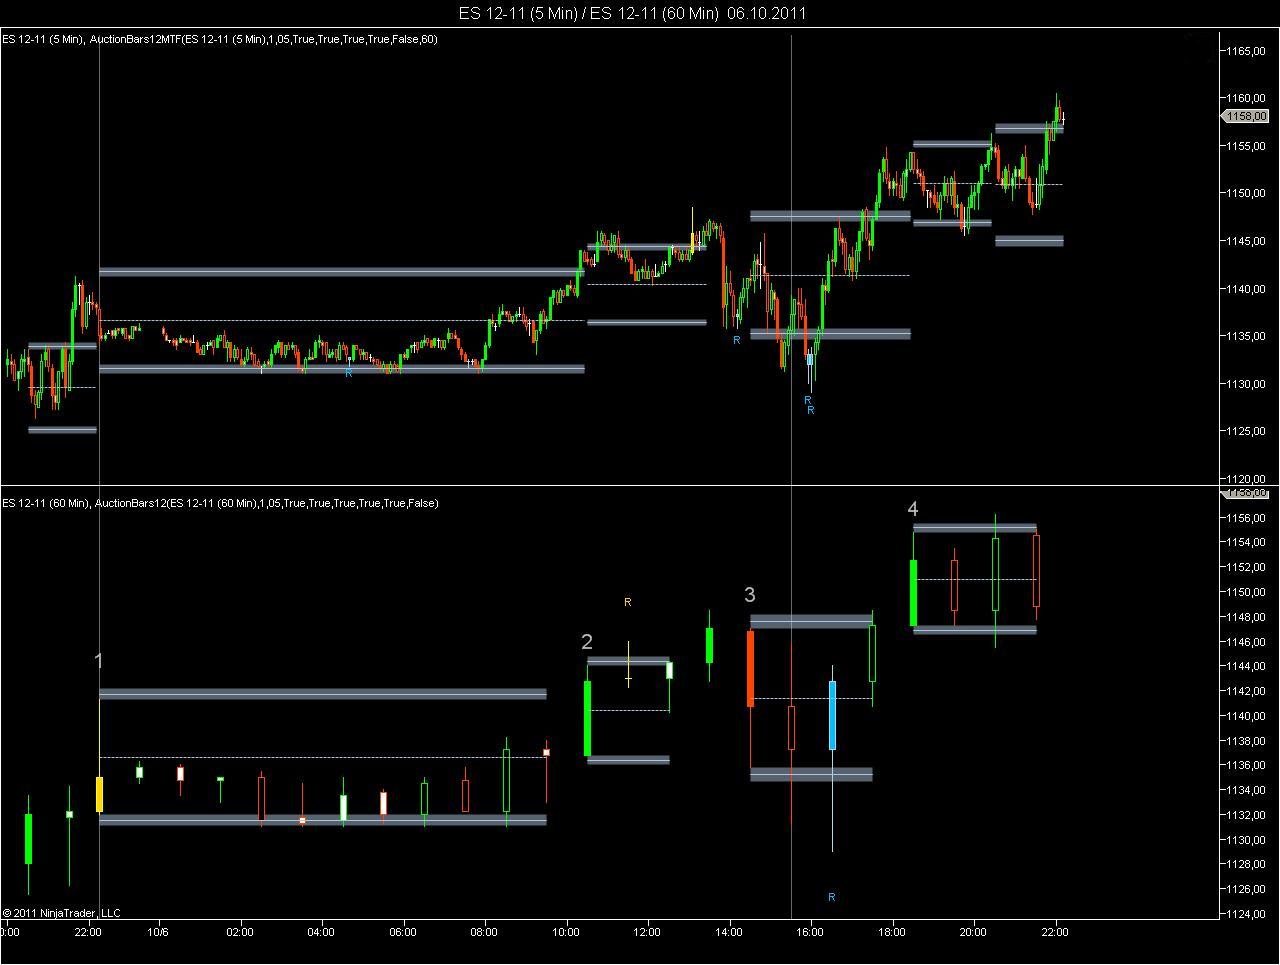
But what you describe is very similar to what I use for my trading. Just to describe how it works, I have attached a chart with two bar series. The upper part of the chart shows the 5 min bars series, the lower part the 60 minute bar series.
For better understanding let us start with the lower part. The indicator determines wide ranging hourly bars which create trading ranges. For yesterday's session there were 4 such bars, which I have labelled 1, 2, 3 and 4. The trading range then remains active, until there is an hourly close above or below that range. The first trading range which remained active during 11 hours of the night session, was created by the last bar of Wednesday's session.
The indicator identifies
- small body bars (white color)
- inside close bars (bars that close inside the trading range, no color)
- thrust bars (bars that close outside the range of the prior candle, not shown on the chart)
- auction bars (thurst bars with a significant range that shift the value zone, lime or red)
- reversal bars (potential reversal bars, blue or yellow, when confirmed an R is added)
For Thursday's session there were three hourly auction bars up (lime) and one hourly auction bar down (red).
Now let us go back to the upper part of the chart.
On the upper part of the chart you will find those identical ranges calculated from hourly bars, projected onto 5 minute bars. The upper indicator is a multi-timeframe indicator, which loads hourly bars to calculate the ranges. It can also plot these hourly ranges on tick, volume or range charts.
Thanks for the reply. I was curious to know if you could also send me your indicator test run. I'd like to see if I cant run through it and adapt it to what I am trying to do.
I will come back in a few days, when it is finished. I am still fighting with the logic for real-time processing. I do not want to recalculate the ranges intra-bar to reduce CPU load, but the paintbars and alerts should fire intra-bar. It is quite tricky to code, because the logic on historical data is the opposite of the logic on real-time data.
The chart shows historical data, real-time results should be identical in the end.