Welcome to NexusFi: the best trading community on the planet, with over 150,000 members Sign Up Now for Free
Genuine reviews from real traders, not fake reviews from stealth vendors
Quality education from leading professional traders
We are a friendly, helpful, and positive community
We do not tolerate rude behavior, trolling, or vendors advertising in posts
We are here to help, just let us know what you need
You'll need to register in order to view the content of the threads and start contributing to our community. It's free for basic access, or support us by becoming an Elite Member -- see if you qualify for a discount below.
-- Big Mike, Site Administrator
(If you already have an account, login at the top of the page)
Does anyone know how can I built a Fear/Greed indicator in order to measure the buying/selling pressure? This indicator exist at Bloomblerg but they dont explain how they calculate it. They just mention that they are using True Range formula.
google it;
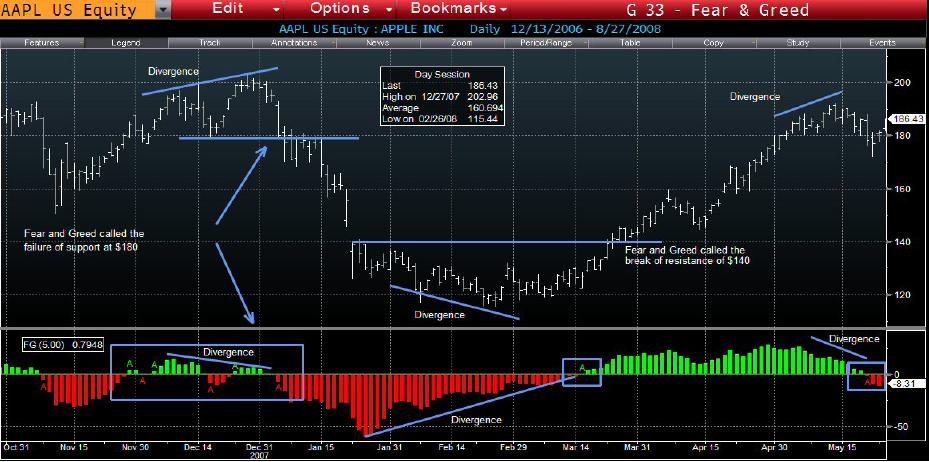
The Fear and Greed indicator is the spread of two weighted moving averages of the True Range. It is calculated in a way that it oscillates on a zero base line. The indicator provides signals in three ways.
1. A buy signal is generated when Fear (red) turns to Greed (green) and a sell signal is generated when Greed (green) turns to Fear (red)
2. Divergence - when price trends lower and fear reaches higher lows or when price trends higher and greed is at a lower high. These are signs of an exhausted trend.
3. When fear or greed spikes to extreme levels it is signaling the start of a top or bottom
The small “A” on the indicator is an alert level. In the settings of the indicator you have the ability to be alerted when the fear or greed exceeds a certain value. In the above, each A appears when it turns above or below the zero line.
The legend for the indicator displays “FG(5.00)” which represents the sensitivity factor. Depending on ones investment style, increasing or decreasing the value of this will speed up or slow down the rate of change of the Fear and Greed value. - Paul Ciana, CMT
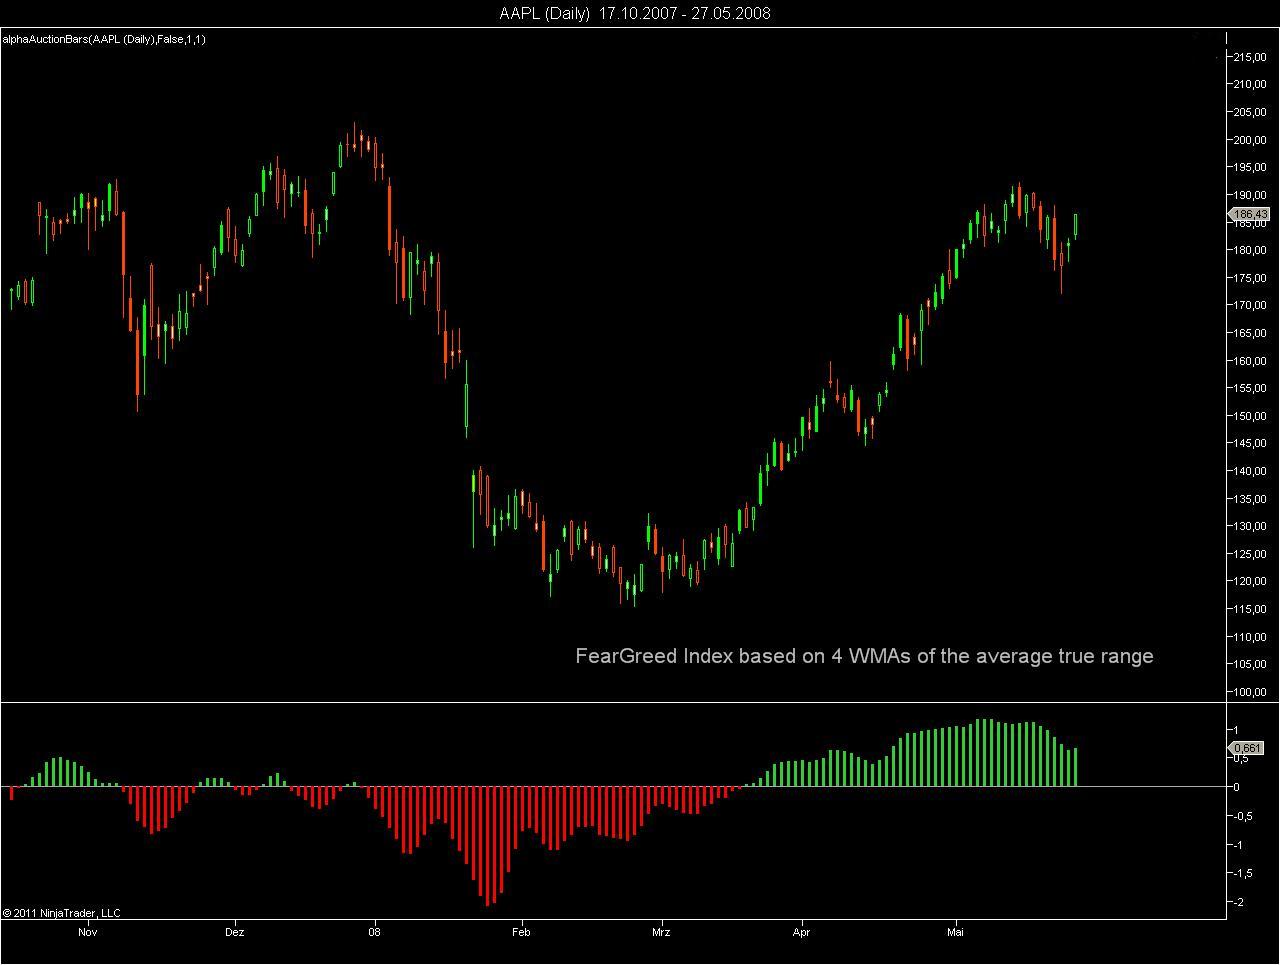
Just had a look at the picture. I love that type of challenge. Rebuilding an indicator without knowing the formula. This is the approach I followed:
-> calculated two range series from the average true range, one from upcloses, the other one from down closes
-> used a fast period to calculate a weighted moving average from both series
-> use a slow period to calculate a weighted moving average from both series, but shift them first by n bars
-> then calculate a MACD type indicator from the four weighted moving averages
The result is an indicator, which is similar to Bloomberg's Fear Greed Oscillator, but not identical. Personally I feel that it looks better than the Bloomberg indicator, so I am happy that I have not created any copy. This is still work in progress, so I do not post it here. Might create an elite thread later.
Applied it to AAPL just to compare it with the other screenshot.
It does, but the indicator is not a MACD built from WMAs. The Fear & Greed Indicator relies on four weighted moving averages calculated from the true range. I still have to test some of the conditions for building them.