NexusFi: Find Your Edge


Home Menu


Double Top / Double Bottom indicator for Multicharts / Tradestation, one available?


Discussion in MultiCharts

Updated
      Top Posters
    1. looks_one PositiveDeviant with 6 posts (2 thanks)
    2. looks_two val2004 with 3 posts (0 thanks)
    3. looks_3 TheTrend with 2 posts (8 thanks)
    4. looks_4 maxk with 1 posts (0 thanks)
      Best Posters
    1. looks_one Robin Hood with 8 thanks per post
    2. looks_two TheTrend with 4 thanks per post
    3. looks_3 Nicolas11 with 1 thanks per post
    4. looks_4 PositiveDeviant with 0.3 thanks per post
    1. trending_up 16,406 views
    2. thumb_up 19 thanks given
    3. group 6 followers
    1. forum 13 posts
    2. attach_file 3 attachments


Search this Thread

Double Top / Double Bottom indicator for Multicharts / Tradestation, one available?

  #1 (permalink)
 
PositiveDeviant's Avatar
 PositiveDeviant 
United Kingdom
 
Experience: Intermediate
Platform: Multicharts
Trading: Dow
Posts: 587 since Nov 2010
Thanks Given: 257
Thanks Received: 256

Hi there folks. I just started recently using Multicharts and have programmed my own indicator into it.

I pick out double tops / double bottoms on my indicator and use them as signals therefore it would be really useful to automate this process, so I can be alerted when one appears, and also perhaps later on, use it as the basis for an automated strategy. I'm new to programming and although I intend to learn Easy Language it's beyond my ability right now.

Is anyone aware of an indicator that will search data and highlight or show where double tops and double bottoms are. On futures.io (formerly BMT) I can only see one for NinjaTrader and whilst there are a couple I've found that are on sale via other sites ($99 / $250) I thought I'd ask around before I go ahead and buy one.

What I'm not clear on is that if I buy one, will I be able to see / amend the code later on?

Thanks

"The primary thing required to obtain what you want from life, is simply the will to pursue it, and the faith to believe it is possible." - Author Unknown

"The ability to maintain discipline and stick to the rules is the hallmark of the experienced successful trader" - Curtis Faith
Visit my NexusFi Trade Journal Started this thread Reply With Quote

Can you help answer these questions
from other members on NexusFi?
NexusFi Journal Challenge - April 2024
Feedback and Announcements
My NT8 Volume Profile Split by Asian/Euro/Open
NinjaTrader
ZombieSqueeze
Platforms and Indicators
Request for MACD with option to use different MAs for fa …
NinjaTrader
 
Best Threads (Most Thanked)
in the last 7 days on NexusFi
Retail Trading As An Industry
67 thanks
Battlestations: Show us your trading desks!
48 thanks
NexusFi site changelog and issues/problem reporting
47 thanks
GFIs1 1 DAX trade per day journal
32 thanks
What percentage per day is possible? [Poll]
31 thanks

  #2 (permalink)
 TheTrend 
Paris, France
 
Experience: Advanced
Platform: Amibroker
Trading: Futures, Stocks
Posts: 95 since Jun 2011
Thanks Given: 118
Thanks Received: 105

Here is a quick code that might help you to play around.

Take care to the strength parameter which is quite sensitive in the pattern determination.

I remmember from Suri Dudella's webinar that he optimises his swing points to find ABCs... it might be an idea to find the best value.

I'll send you my bank account number for the payment

Hope that helps.


Code
Input: Lookback(50),Strength(5);
Var: LastHighPivotbar (0),LastLowPivotbar (0),PreviousHighPivotbar (0),PreviousLowPivotbar(0),
LastHighPivot (0),LastLowPivot (0),PreviousHighPivot (0),PreviousLowPivot(0),DT (False),DB (False);

LastHighPivotBar = PivotHighVSBar(1,H,Strength,Strength,Lookback);
LastLowPivotBar = PivotLowVSbar(1,L,Strength,Strength,Lookback);
PreviousHighPivotBar = PivotHighVSBar(2,H,Strength,Strength,Lookback);
PreviousLowPivotBar = PivotLowVSbar(2,L,Strength,Strength,Lookback);
LastHighPivot = PivotHighVS(1,H,Strength,Strength,Lookback);
LastLowPivot = PivotLowVS(1,L,Strength,Strength,Lookback);
PreviousHighPivot = PivotHighVS(2,H,Strength,Strength,Lookback);
PreviousLowPivot = PivotLowVS(2,L,Strength,Strength,Lookback);

/////////////////////////////DT/////////////////////

If LastHighPivot <> - 1 and LastLowPivot <> -1 and PreviousHighPivot <>-1 and PreviousLowPivot <> -1

	and PreviousHighPivot < PreviousLowPivotBar + averagetruerange(10)
	and PreviousHighPivot  > LastHighPivot  - averagetruerange(10)
	and LastHighPivot > LastLowPivot + 3* averagetruerange(10)
	and LastLowPivotbar > LastHighPivotbar 

then begin

	DT = TRUE;
	end
	else begin
	DT = False;
	
end;

If DT = True then begin

	Plot1 [PreviousHighPivotBar ](PreviousHighPivot ,"DT1",Blue);
	Plot2 [LastHighPivotBar ](LastHighPivot  ,"DT2",Blue);
end;

/////////////////////////////DB/////////////////////

If LastHighPivot <> - 1 and LastLowPivot <> -1 and PreviousHighPivot <>-1 and PreviousLowPivot <> -1

	and LastLowPivot < PreviousLowPivot + averagetruerange(10)
	and LastLowPivot > PreviousLowPivot - averagetruerange(10)
	and LastHighPivot > LastLowPivot + 3* averagetruerange(10)
	and LastHighPivotbar > LastLowPivotBar 

then begin

	DB  = TRUE;
	end
	else begin
	DB  = False;
	
end;

If DB = True then begin

	Plot3 [PreviousLowPivotBar ](PreviousLowPivot ,"DB1",Yellow);
	Plot4 [LastLowPivotBar ](LastLowPivot,"DB2",Yellow);
end;

Attached Images
 
Reply With Quote
The following 7 users say Thank You to TheTrend for this post:
  #3 (permalink)
 
PositiveDeviant's Avatar
 PositiveDeviant 
United Kingdom
 
Experience: Intermediate
Platform: Multicharts
Trading: Dow
Posts: 587 since Nov 2010
Thanks Given: 257
Thanks Received: 256


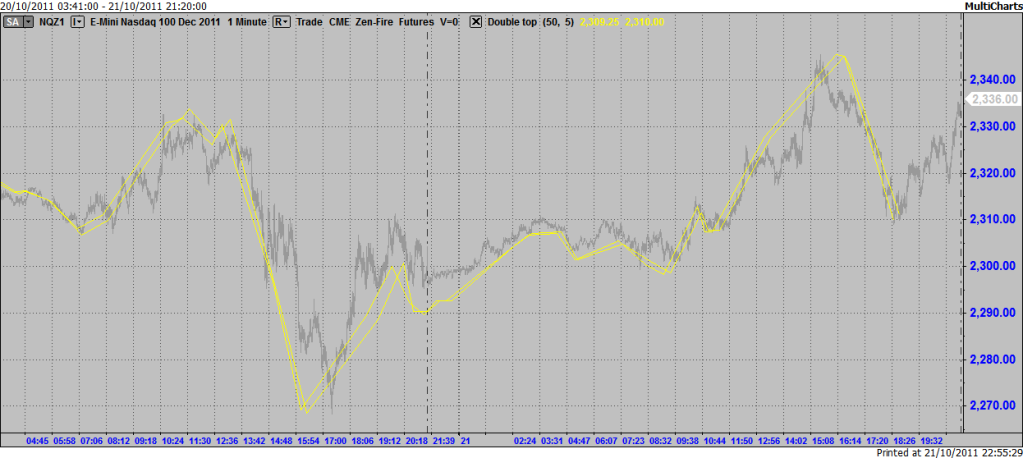
Hi there, thanks very much for this but it doesn't seem to do the same as your chart when I put it on my chart...


"The primary thing required to obtain what you want from life, is simply the will to pursue it, and the faith to believe it is possible." - Author Unknown

"The ability to maintain discipline and stick to the rules is the hallmark of the experienced successful trader" - Curtis Faith
Visit my NexusFi Trade Journal Started this thread Reply With Quote
The following user says Thank You to PositiveDeviant for this post:
  #4 (permalink)
 TheTrend 
Paris, France
 
Experience: Advanced
Platform: Amibroker
Trading: Futures, Stocks
Posts: 95 since Jun 2011
Thanks Given: 118
Thanks Received: 105

You have to setup the indicator with points instead of lines.

However, this is not the holy grail, it will find some sweet spots but will find some bad ones as well.

You need to consider this as a starting point.

My exemple was of course a well-chosen vendor-like exemple

Reply With Quote
The following user says Thank You to TheTrend for this post:
  #5 (permalink)
 
PositiveDeviant's Avatar
 PositiveDeviant 
United Kingdom
 
Experience: Intermediate
Platform: Multicharts
Trading: Dow
Posts: 587 since Nov 2010
Thanks Given: 257
Thanks Received: 256

Ok, thanks.

"The primary thing required to obtain what you want from life, is simply the will to pursue it, and the faith to believe it is possible." - Author Unknown

"The ability to maintain discipline and stick to the rules is the hallmark of the experienced successful trader" - Curtis Faith
Visit my NexusFi Trade Journal Started this thread Reply With Quote
The following user says Thank You to PositiveDeviant for this post:
  #6 (permalink)
 
Robin Hood's Avatar
 Robin Hood 
Belgium / Brussels
 
Experience: Beginner
Platform: MultiCharts & Ninja
Broker: IB
Trading: Dax, Bund, NQ, Stocks & sml cap
Posts: 18 since Feb 2010
Thanks Given: 287
Thanks Received: 23

I don't know if this can help U but I have this indie showing HH-HL-LL-LH and also DT-DB .
It's basic but it was a great help for me at my beginning.
have fun

Attached Thumbnails
Click image for larger version

Name:	DT_DB_MC_2011-10-22_0045.png
Views:	698
Size:	15.8 KB
ID:	52823  
Attached Files
Elite Membership required to download: hhll.txt
Reply With Quote
The following 8 users say Thank You to Robin Hood for this post:
  #7 (permalink)
 
PositiveDeviant's Avatar
 PositiveDeviant 
United Kingdom
 
Experience: Intermediate
Platform: Multicharts
Trading: Dow
Posts: 587 since Nov 2010
Thanks Given: 257
Thanks Received: 256

That's really useful, thanks. Now I just need to work out how I get it to work on a line chart. I have an indicator I created and I want to find the double bottoms / tops on that. The indicator plots as a line whereas your indicator seems to the need bar values, rather than what is provided on a line chart.

I'm getting closer to what I need though...

I think I need to be able to set my indicator as a new dataseries and then use your indicator on the new dataseries...

"The primary thing required to obtain what you want from life, is simply the will to pursue it, and the faith to believe it is possible." - Author Unknown

"The ability to maintain discipline and stick to the rules is the hallmark of the experienced successful trader" - Curtis Faith
Visit my NexusFi Trade Journal Started this thread Reply With Quote
  #8 (permalink)
 
PositiveDeviant's Avatar
 PositiveDeviant 
United Kingdom
 
Experience: Intermediate
Platform: Multicharts
Trading: Dow
Posts: 587 since Nov 2010
Thanks Given: 257
Thanks Received: 256

Well I spent endless hours yesterday trying to find out how to use the indicator on this thread on my chart. My chart plot itself is the product of my indicator. I'm sure this must be possible but will most probably have to contact multicharts to find out how to do it.

"The primary thing required to obtain what you want from life, is simply the will to pursue it, and the faith to believe it is possible." - Author Unknown

"The ability to maintain discipline and stick to the rules is the hallmark of the experienced successful trader" - Curtis Faith
Visit my NexusFi Trade Journal Started this thread Reply With Quote
  #9 (permalink)
val2004
ISLAND SAMOA
 
Posts: 5 since Jan 2011
Thanks Given: 2
Thanks Received: 1

did you try to convert the priceswingindicator coded for nt into multicharts ?

Reply With Quote
  #10 (permalink)
val2004
ISLAND SAMOA
 
Posts: 5 since Jan 2011
Thanks Given: 2
Thanks Received: 1


The trend;

one question: the code you have posted is for ts exclusively

did you try to dig more on the methodology to find better swing points and eliminate some candidates ?

Reply With Quote


Last Updated on September 5, 2023


© 2024 NexusFi™, s.a., All Rights Reserved.
Av Ricardo J. Alfaro, Century Tower, Panama City, Panama, Ph: +507 833-9432 (Panama and Intl), +1 888-312-3001 (USA and Canada)
All information is for educational use only and is not investment advice. There is a substantial risk of loss in trading commodity futures, stocks, options and foreign exchange products. Past performance is not indicative of future results.
About Us - Contact Us - Site Rules, Acceptable Use, and Terms and Conditions - Privacy Policy - Downloads - Top
no new posts