( https://www.kumotrader.com/ichimoku_wiki/ )
In this case, there is a third longer term line 3* the usual 2nd line (Kijun). Why? Because it will line up with a longer term chart 3* higher (i.e. trading chart 150 ticks, LT 450 ticks, or 5 and 15 mins).
Also because the longer term line will often line up exactly with the Clouds that are drawn 27 bars ahead based on current action. The LT Clouds are drawn 81 bars ahead and are the equivalent to the Clouds in the LT chart. This way you don't really need the LT chart but also you see the relationship of shorter and longer term cycles/trends on the same screen which is helpful.
The Ichi3Lines indicator has (too) many bells and whistles such as a Bollinger 'tunnel', triangles that show simple pattern pullbacks within an Ichi trend. But it also has aspects of the official method not available in other indicators such as:
Circles plotted when the Clouds (Senkou Spans) cross up or down, and in my case with slightly different colors so you know immediately whether it's a long term cross or short term cross (these are happening off the screen in the 'future').
There is also a diamond plotted along with an optional line when there is a 'Chikou' cross, which is the current price crossing above or below the Chikou line which is plotted 27 bars in the past. This line is not on the chart because when viewing an historical chart it is very messy. In actual trading that line is in the past and is fine.
There are arrows indicating the basic 9-27 cross (tenkan-kijun).
There are pink arrows indicating when the longer term Kijun (KijunLT) which I have added (darker green plot) crosses above or below the cloud plot. These are strong confirmations of a strong trend indicating longer term breakouts.
There are also many back color options which only work on lighter screens so this picture with black background does not show them.
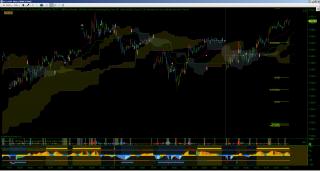
On this picture, to reduce screen noise, I also did not plot the basic Tenkan and Kijuns (sacriledge!) and only plotted the Kijun LT (dark green dash line) and my own 'equilibrium line' (pink dotted line) which is the average of the Tenkan(9), Kijun(27) and KijunLT (81) medians, the idea being that this is the current equilibrium price. It is around this price that the oscillator is built.
The oscillator: in addition, there is an Ichi 'Squeeze' Oscillator which is quite good but which unfortunately has a small glitch in that sometimes the lines don't plot and I can't figure out why. Also, it seems to happen only with minute bars. They used to work and now they don't and I must have changed something at some point and now can't find out what.
It is designed to help in identifying the longer and shorter term trends together, when they are lined up or not, but also has a faster line (Combo) that is pretty effective at showing extreme OB and OS conditions. There are three lines in the usual 0, OB and OS areas which display the ST, Medium Term and LT slopes of the Tenkan(9), Kijun(27) and KijunLT(81) medians respectively. There are also thicker lines above and below which show when all three trends are lined up.
The oscillator bars plot green when the Tenkan and Kijun slopes are not in agreement, i.e. often during consolidation or retracement zones and indicate caution/indecision. Also excellent for possible pullback/retracement entries in direction of overall trend which has not yet changed but is being challenged.
So for those who like the Ichimoku approach or those who wish to study it, this will prove helpful.
Best to disable most of the bells and whistles such as the Bollingers, pullback arrows and triangles and just work with the lines, Chikou span crosses (diamonds on close), Senkou Span crosses (cloud crosses that are in the clouds indicator and always plot), and the main signal arrows.
Oh. there is also an extreme OB/OS plot (pink diamonds) when the price has moved unusually far from the Kijun (middle green line) based on ATR and that distance. They are quite effective at indicating when a market has got ahead of itself.
Also, you can select paintbars, including divergence. The divergence colors are hard coded as red (in bull mkts) and magenta (in bears) so for those who have red down bars this won't be very helpful!
For trend trading, Ichis are truly superior. If you have a bearish cross or situation and the price has gone beneath both the ST and LT clouds, something which you will have been watching develop for quite some time because the clouds are drawn ahead of time, there is a strong probability of a sustained trend for a while. Similarly, early pullbacks in that situation often present low risk shorting opportunities, especially if the price retraces to the cloud bottom(s) and stops and especially if they are long, flat bottoms, indicating there was a long period of congestion at equilibrium and that value area is now about to change as all the action that was needed to happen there is past, or new perceptions have entered the market valuation matrix.
If anyone can fix the glitch in the Squeeze, I'd be grateful!
Note on Colors: apart from the fact that most were designed on white backgrounds whereas now I am going back to black, a note on the trend colors. I use what could be called a daoist system of colors which might be confusing: bullish colors are light and rising, bearish colors are darker and heavier so falling, so in my case I use golds and yellows for bullish (lighter, brighter) and blues for bearish (like water, heavier). Reds and Greens are neutral usually used for basic bars, longer term indicators, though often red is for some sort of extreme. For people used to red = bearish blue = bullish this can be confusing.
COMPATIBILITY:
NinjaTrader 6.5: YES
NinjaTrader 7.0: NO (tested by sam028)
Category NinjaTrader 6.5 Indicators
|
|
|


