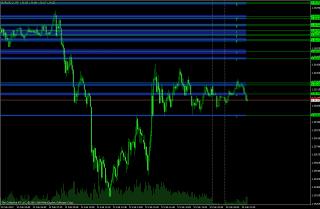
This indicator looks for levels where price has 'bounced' off of before. It then filters these levels by several user-controlled settings and groups nearby levels together to create SR zones (known as Groups in the parameters), and displays a rectangle to represent the SR zone. A single line within each SR zone represents the average price of the levels within.
By default the indicator looks at as much history as possible, so you will want to adjust the settings of your mt4 to hold as much historical data as possible.
You could also use this indicator with less history, to locate only levels where price has reacted recently.
Keep in mind that on charts without much history to the left, such as when price is breaking new ground, there will be fewer lines than on charts where price is revisiting areas recently traded.
Thread with information on the settings is here: https://nexusfi.com/elite-circle/2676-historical-support-resistance.html
I should mention that this is for mt4 not NT. An NT version is in the works.
Category The Elite Circle
|
|
|


