Updated Version 1.21 March 12, 2019
Exported with NT Version 8.0.17.2
Version 1.21 Corrections are described in Change Log
Previous Version 1.1 March 5, 2019
Exported with NT Version 8.0.17.1 (note this has been changed)
Notice(posted on 2/10/2019 at 1:45 PM MST)
It appears that something has changed in the latest NT update (8.0.17.1) that effected this indicator. The version here has been recompiled and re-exported using the latest release. No code changes were made. The version date (2/10/2019) and number (1.01) in the indicator parameters section reflect this change. If you have updated to the latest NT version and are having a problem or getting error messages either recompile the indicator or download and install the latest version.
I apologize for any confusion.
Summary
This indicator is an enhanced version of the NT8 BuySellVolume indicator. The enhancements are as follows:- 1. Buys and Sells are show above and below the zero line,
- 2. The Net Volume (Buys-Sells) is plotted accordingly,
- 3. Total volume is displayed using a separate color and is shown accordingly,
- 4. A divergence marker (Bar close is opposite the Net Volume) can be indicated (not enabled by default),
- 5. Tick Replay (TR) is supported and defaults to display a different color for the TR Net Volume bars,
- 6. The width of the Buy/Sell, total, and Net histogram bars can be set individually, and
- 7. Option to reverse the Histogram Buy/Sell and Net widths so that the Net bar displays on the inside of the Buys/Sell bar.
Notes:- At times the Net volume is so small it can not be seen with the indicator region parameter set in Linear Mode. This can be rectified by setting it to Log mode as shown in the screenshot.
- When changing the histogram bar sizes use odd numbers as the bars are painted from the midpoints.
- For a divergence to be detected in addition to the Net number and bar direction being opposite it must pass a percentage check. If too many (too few) divergences are detected the percentage can be changed to reduce (increase) the number detected.
- When using the Tick Replay with a large number of historical days (Days to Load) there may be a delay in the time it takes to initialize.
- The indicator is installed in a folder named �Cheech�.
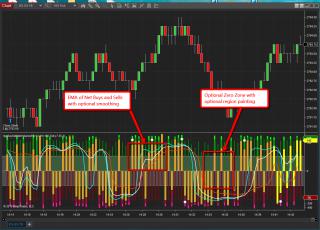
Version 1.1 Enhancements- Fast and Slow EMA of Net Buy and Sells with optional midrange which when set the period is the midpoint of the Fast/Slow period settings.
- User defined volume offset from Zero line will create a Zero Zone with optional region painting.
- Reorganized Indicator Parameters.
Version 1.1 Notes:- If EMAs are too close together set the indicator panel properties Type Parameter to Logarithmic
- NT will display the upper and lower boundary lines (the zero zone) under the following conditions; 1. tick replay is enabled, 2. real time data is available (data feed is connected and market is opened), or, 3. the Zero Zone region painting is enabled. When any of the aforementioned are satisfied the lines will appear.
Version 1.21 Notes:
1. The labels of the MA plots were mis-labled as SMAs when they are actually EMAs.
Please PM me with either problems or questions instead of using the comments/rating section.
Change Log
Date_______Description
2/2/2019..........Initial release
2/10/2019........Recompiled and exported using NT 8.0.17.1
3/05/2019........Additional Enhancements described above
3/12/2019........Correct minor error in MA calculations, some code optimization, and Typos in Labels
4/13/2019........Deprecated, replaced by version 2
Category NinjaTrader 8 Indicators and More
|
|
|


