
Efficient indicators ensure the utmost in responsiveness with rock solid stability and dependability. Also added error trapping... just in case.
The techniques used include:- - incorporating all supporting calculations into the indicator to eliminate calls to external classes SUM and CMO.
- - calculating only on FirstTickOfBar the variable values that depend only on previous bar data.
- - removing redundant processing steps, eliminating intermediate, locally declared variables and combining calculations into a minimal number of algebraic expressions.
- - allowing OnBarUpdate to execute only when it will affect the output result.
- - providing the option of disabling the setting of plot values and colors when called by another indicator or strategy.
- - providing a public data series to give the output values when called by another indicator or strategy, even it this indicator is running in the background with ShowPlot false, with no plot values being set.
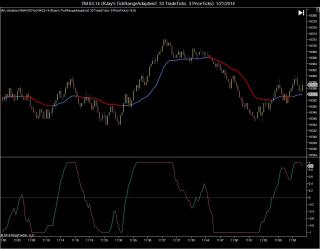
The Variable Moving Average (VMA) or Volatility Index Dynamic Average (VIDYA), developed by Tushar S. Chande, uses a Volatility Index to adjust the smoothing period. When prices are congested the average slows down and when prices are trending the average speeds up (note steps in plot).
The indicator is completely self contained. There are no calls to external indicators.
If you call this indicator from another indicator or from a strategy, set the ShowPlot parameter to false to avoid wasting resources setting the values and colors of plots that are not being displayed, and get your outputs from the public dataseries that was provided specifically for that purpose.
Category The Elite Circle
|
|
|


