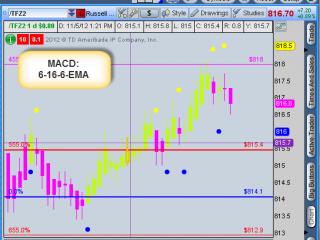
# MACD Dots on Price Chart
# Shows Primary Signals only. Once a BuyAlert is issued another BuyAlert cannot be issued until after a SellAlert has been issued, etc.
# Change Displace value below to adjust where Dots are placed on the Price Chart
input displace = .001;
input fastLength = 6;
input slowLength = 16;
input MACDLength = 6;
input AverageType = {SMA, default EMA};
def Value = MACD(fastLength, slowLength, MACDLength, AverageType).Value;
def Avg = MACD(fastLength, slowLength, MACDLength, AverageType).Avg;
def BuyAlert = Value > Avg;
def SellAlert = Value <= Avg;
rec count=if BuyAlert==1 and count[1]==0 then 1 else if SellAlert==0 and count[1]>=1 then count[1]+1 else 0;
rec count1=if SellAlert==1 and count1[1]==0 then 1 else if BuyAlert==0 and count1[1]>=1 then count1[1]+1 else 0;
def PrimaryBuyAlert = BuyAlert==1 and count==1;
def PrimarySellAlert = SellAlert==1 and count1==1;
plot DotUp = if PrimaryBuyAlert then Low * (1 - displace) else double.nan;
DotUp.SetPaintingStrategy(PaintingStrategy.POINTS);
DotUp.SetDefaultColor(Color.BLUE);
DotUp.SetLineWeight(5);
DotUp.HideBubble();
DotUp.HideTitle();
plot DotDn = if PrimarySellAlert then High * (1 + displace) else double.nan;
DotDn.SetPaintingStrategy(PaintingStrategy.POINTS);
DotDn.SetDefaultColor(Color.YELLOW);
DotDn.SetLineWeight(5);
DotDn.HideBubble();
DotDn.HideTitle();
Category ThinkOrSwim
|
|
|


