Phases
1. Up-Trend: An up-trend is a confirmed range breakout to the up-side, a consolidation continuation, or a down-trend that pulls back Initial Range ticks over n-Periods.
2. Up-Trend Consolidation: An up-trend consolidation period is when a new trend high has not been set in Consolidation Periods, but price has not pulled back Pull-Back Ticks.
3. Up-Trend Pull-Back: An up-trend pull-back is when price has moved down Pull-Back Ticks from the trend high. If price pulls back Initial Range ticks over n-Periods, the market is considered to be in a new down-trend.
4. Up-Trend Breakout: An up-trend breakout is when price moves Breakout Ticks above the current range high. If price remains above the range high for Confirmation Periods, the trend is considered an up-trend.
5. Upper Range: If the current range is at least Tradeable Range wide, and price is in the upper Range Percentage of the range, the market is in the upper range phase.
6. Range: The market is ranging if price is consolidating OR pulling back, BUT has not broken out of the previous high or low n-Periods from that high or low AND price has not moved Initial Range ticks over n-Periods in the same direction as a pull-back.
7. Lower Range: If the current range is at least Tradeable Range wide, and price is in the lower Range Percentage of the range, the market is in the lower range phase.
8. Down-Trend Breakout: A down-trend breakout is when price moves Breakout Ticks below the current range low. If price remains below the range low for Confirmation Periods, the trend is considered a down-trend.
9. Down-Trend Pull-Back: A down-trend pull-back is when price has moved up Pull-Back Ticks from the trend low. If price pulls back Initial Range ticks over n-Periods, the market is considered to be in a new up-trend.
10. Down-Trend Consolidation: A down-trend consolidation period is when a new trend low has not been set in Consolidation Periods, but price has not pulled back Pull-Back Ticks.
11. Down-Trend: A down-trend is a confirmed range breakout to the down-side, a consolidation continuation, or an up-trend that pulls back Initial Range ticks over n-Periods.
Parameters
Periods, Initial Range, Tradeable Range, Pull-Back Ticks, Breakout Ticks, Confirmation Periods, & Consolidation Periods: See Above Description
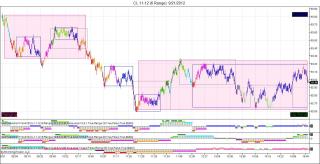
Color Outlines: Colors candle outlines according to the current phase.
Range Lines: Draws lines at the current range high and low. Note: This indicator updates the highs and lows based on price action. These lines could move in real time.
Range Zone: Draws a Range Color rectangle during ranging periods from the current range start period to current bar,
Zone Opacity: Opacity of the Range Zone rectangle.
Message Parameters
Phase Message: Draws a text box with the current phase in the in the selected position.
Message Position: Positions phase message in desired corner. 1=Upper-Right, 2=Lower-Right, 3=Lower-Left, 4=Upper-Left
Message Font: Font used for phase message.
Font Size: Font size used for phase message.
MTF Parameters
MTF: If true, a custom MTF data-series is used to calculate market phases.
Periods: Periods or value of custom MTF input series.
Period Type: Type of periods used for custom MTF input series(Day, Minute, Range, Second, Tick, or Volume).
Colors
-The colors for the 11 market phases can be set by the user.
Please visit the discussion thread for a sample MTF template.
Discussion Thread:https://nexusfi.com/elite-circle/23149-xavpriceactiontrend-discussion.html
Enjoy
Change-log:
9/16/12 - V1b released. Added Range Zones and Phase Message. Fixed 1 bar lag for range.
9/17/12- V1c released. Fixed pull-back to new trend bug.
9/22/12- V2 released. Added MTF capabilities. Made range max and min public dataseries. Made message customizable.
Category The Elite Circle
|
|
|


