The PowerLanguage file contains the following indicators:
- Fibonacci Lines (Daily); this indicator plots the Fibonacci lines for the current day;
- Fibonacci Lines (Yesterday); this indicator plots on the current day the Fibonacci lines for yesterday;
- Fibonacci Lines (Weekly); as you guessed it, this indicator plots the weekly Fibonacci lines.
Each of these indicators have the following features:
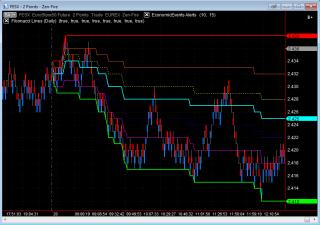
- Fibonacci lines 76.4%, 61.8%, 38.2%, 23.6% as well as the high, low, and 50% level;
- Option to individually turn each of these lines off;
- Fibonacci levels are rounded to the number of decimals of the instrument;
- To keep MultiCharts as efficient as possible, the new Fibonacci levels are only calculated at the close at the bar instead of on every tick. You can change the code to calculate on every tick.
- Option to only display the current Fibonacci levels and not those of the previous day(s). This prevents chart skewing at the beginning of the day, when the current price is some distance from the previous Fibonacci levels, which leads to ugly charts. (See the attached screenshot to see how not plotting the values for yesterday gives a much clearer chart).
Category MultiCharts
|
|
|


