This version corrects a bug in the elapsed time calculation when a session break occurs. This may or may not be noticeable when a session break occurs during a weekday but is most definitely noticeable over a weekend session break.
Exported with NinjaTrader: 7.0.1000.34 Release Date: 11/17/2017
Indicator Name: fpgExportCsvData
Updated 12/6/2017
Fixes and Enhancements are as follows:
Fixes:
- Correct error writing to Closed file on termination
- Cleaned up Error messages, Initialization, and Statistical messages
- Eliminate extra .csv header on appended file
- Eliminate the Print Error option, always print the errors to the Output Window
- Other minor fixes
Enhancements:
- Remove requirement for the slash before file name
- Further qualify the file name by adding "_Detail" to the end
- Supports all bar types. Removed the bar type restriction and unneeded override facility
- Implemented a directory service to track the created export files.
- Shorten the .csv headers to save column space in the excel file.
- Added in an ATR, EMA, and SMA with adjustable periods
- Implemented the option to include up to 5 other MAs from a list of about 30.
Notes:- The Directory file is in the same folder as the data files
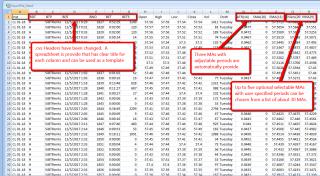
- The .csv headers are different in that they are shorter and not very readable. A spreadsheet had been provided for
both the Detail and Directory files and can be found here.
- Even though the headers are different with the exception of the additional columns the order is the same therefore
any Excel sheets you may have designed can still be used.
- The provided and optional moving averages do not plot
Warning:
Installing this version will replace the existing one. Copy the original to a different folder if you need/want to
revert to the previous version.
Original Post Starts here
This indicator collects various chart data and exports the data to a .csv file which can be directly imported into Excel for further analysis. Both the path and filename must be specified by the user. The indicator was designed for traders that may not have Excel on their trading platform or have no need to do any real time analysis.
There are four ways that the data can be filtered as shown below. Data that is filtered by a higher level is passed to the next lower level.
- Historical Only, RealTime Only, or Both
- All dates (as controlled by the Days to load in the Data Series) or by selected date ranges. Up to 3 non-contiguous ranges date ranges can be specified (but must be in oldest to newest order).
- All days of the week or by selected days of the week.
- All 24 hours or by selected time ranges. Up to 3 non-contiguous time ranges that can be specified (again in order). The time ranges are specified in 24 hour format.
The input format of the date and time parameters are described in the indicator parameters and must be exactly as shown. However, there is a special use of zeroes and a minus one as follows:
- A zero in the �Start� field for either the date or time section means to start collecting from the first bar according to what was specified for number 1 above. The zero is only valid for the first entry (pair 1) of both date and time.
- A zero in the �End� field of either the date or time section means to continue collecting data unless otherwise controlled by a higher level parameter. If Used, a zero in the End field can only be in the last used pair.
- Although zeroes can be specified in both the Start and End parameters (only in pair 1) of either the date or time section doing so is the same as the �All� option and is internally changed to an All setting.
- A minus one is used only as a place holder and is not valid in an enabled pair
Notes:
- If using either non-contiguous dates or times be careful when doing Excel computations between them. An easy way to check for this condition is to check for a break in the sequence of the bar numbers.
- By default the indicator checks for Renko and Range bars and has been tested with them. However, this check can be turned off so that other bars types can be used, but only limited testing has been performed. If you have a problem with other bar types PM me with the details.
- The complete path name must be used in the format Drv:\RootFolder\OneOrMoreSubfolders\Filename. If drive is not specified it defaults to the C: drive.
- The path and filename are separate entries and must be entered as documented in the parameter description. The .csv file extension is automatically added and must not be specified. If the file does not exist it is created. If the file does exist the newly collected data is appended to any data that was previously collected. If for some reason the file cannot be opened an error message is displayed on the chart and a message is written to the NT log that contains additional information. The most likely causes are either the path or path permissions are set incorrectly.
WARNINGS: - if the file already exists the data is appended to the file therefore the data can be duplicated depending on the parameters used. This can easily happen if a refresh has occurred without an intervening file name or collection parameter change.
- In most situations the last data buffer is not flushed out until the indicator is removed, or the chart or workspace has been closed, except as noted below.
Exceptions:- If Historical Only data is being collected the first RealTime record stops the recording and the file is closed, and,
- When the last date range has been collected the recording stops and the file is closed.
In all other situations the indicator, chart, or workspace must be closed to flush the last buffer.
The easiest way to use this indicator is to create a new chart with the desired bar type and Data Series declarations, preferably in its own workspace, and add only this indicator setting the desired parameters. The workspace can be run in the background if RealTime Only or Both are being collected. For Historical Only, set up the data collection in the same way but depending on the amount of historical data being collected it may not necessary to run it in the background as it is relatively fast.
Some programs (Notepad++, �) will allow access to the file even without it being closed. Moving or deleting will require that the file be in a closed state.
Parameter checking is performed and if there are errors a warning message is displayed in the lower right section of the price panel. Also, detailed error messages can be displayed to the Output window if the appropriate parameter is set to true. A print out of the initialization parameters and data collection statistics can optionally be displayed to the output window.
The screen shot shows a partial file that was imported into Excel with the data fields names at the top.
Change Log
Date............Description
12/11/2017......Fixes elapse time calculation over session break
12/6/2017........Fixes and Enhancement described above
11/17/2017......Initial release
Category NinjaTrader 7 Indicators
|
|
|


