I wrote these studies with the intention of applying them to the S&P500 and the VIX, however they may be applied to any pair of data series.
To use, load a minute chart window with the SPY as data1 and the VIXY as data2. Make sure both series have the same bar settings ( ie, 5 minute and 5 minute ).
The paint bar study has a slightly weakened algorithm in order to give the viewer a �heads up� that the show me indicator may signal.
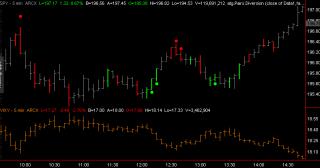
The example chart is 5 minute from 9/8/2015
Interpretation
- A green dot under a bar is a long signal. It means the VIX is falling at a relatively greater quantity than the S&P is rising.
- A red dot above bar is a short signal. It means the VIX is rising at a relatively greater quantity than the S&P is falling.
The studies work as follows:- The data series for data2 ( the VIX in our example ) is inverted by calculating the reciprocal of the close ( 1/close). This effectively flips the chart upside down.
- The natural logarithmic returns for data1 and data2 are calculated and stored in a pair of data series for each.
- The difference between the returns series are run through a pair of RSI oscillators in order to discover progressive divergences between them.
Category The Elite Circle
|
|
|


