Works on at least TradeStation 9.0 and later
Description:
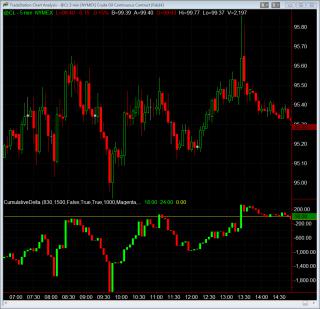
Plots the cumulative delta (orders lifting offers - orders hitting bids) in a sub graph below the main chart for most chart types in TradeStation.
Usage:
The indicator plots the difference between Upticks and Downticks for each bar in a Hi-Lo bartype fashion. The close of the previous bar is the open of the new bar. It does not draw the wicks, just the open and close. The code maintains the running Upticks-Downticks tally in a bar and plots the difference realtime for the last bar on chart if update intrabar option is checked. It allows the trader to specify pit open/close times and the option to reset (start from 0) the cumulative delta at either the pit open time or the pit close time or both. A zero line can be plotted if required. Also allows the user to specify an Alert limit such that when the delta goes over this limit, that CD bar can be colored with the Alert Color. The Up Color and Down Color can also be specified.
Works on the following chart types:- Time
- Tick (using Trade Vol instead of Tick Count for chart volume)
- Volume (using Trade Vol instead of Tick Count for chart volume)
- Momentum
- Range
Input Parameters:- PitOpen - Time in HH24MM format (eg: 0800 for 8 AM and 1600 for 4 PM)
- PitClose - Time in HH24MM format (eg: 0800 for 8 AM and 1600 for 4 PM)
- ResetAtPitOpen - True/False values only
- ResetAtPitClose - True/False values only
- PlotZeroLine - True/False values only
- AlertBar - Numerical, positive value only. The code uses an absolute value before comparing.
- AlertColor - Any TradeStation color like Magenta, Cyan, Yellow, White etc.
- UpColor - Any TradeStation color like Magenta, Cyan, Yellow, White etc.
- DownColor - Any TradeStation color like Magenta, Cyan, Yellow, White etc.
Change Log:- 12/26/2013 - v1.0 - Initial Upload
Category TradeStation (hidden)
|
|
|


