Some features from this indicator:
- It plots the UpTicks minus DownTicks to get an idea of the buying pressure;
- This is divided by the time it took to form a bar, so that on tick and point charts you'll get an truer picture of the volume;
- This buying pressure per minute is divided by the standard deviation, which helps to identify little shifts in buying pressure that would normally get lost. (This also means that any buying pressure below or above a certain number of standard deviations can be seen as significant volume).
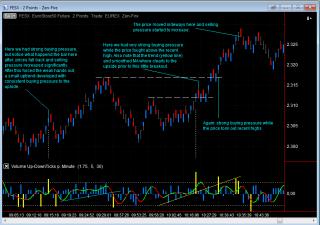
Especially these extreme values (which are signalled in yellow) are of importance to the trader. As an interpretation tip: also look at the price action of the bar after the extreme buying or selling pressure to get an idea of where the price might go to. So, combine it with regular price action and look at the trend in the histogram.
Category MultiCharts
|
|
|


