The Directional Trend Index (DTI) was developed by William Blau and published in his book "Momentum, Direction and Divergence".
To determine the value of the DTI William Blau first calculates a composite momentum from both highs and lows of the last days. In a next step both the composite momentum and the absolute values of the composite momentum are smoothed. The smoothed momentum is then divided by the smoothed absolute momentum and the result is multiplied with 100.
Momentum smoothing: William Blau smoothed both momentum and absolute momentum by applying an EMA several times (double or triple smoothing). This indicator allows to use 16 different moving averages for the smoothing. The same moving average type is used for all three average calculations.
Parameters: The lookback period for the momentum the number of bars from which the momentum is calculated. Blau uses a lookback period, which is different from the standard momentum. To obtain a 1-period momentum (price change from the last to the current bar) the Directional Trend Index requires a setting of 2 for the lookback period (default setting).
Signal line: William Blau did not use a signal line for the double smoothed indicators. I have added the signal line, because the cross of the signal line can be used as a trend indication. Moving average type and period for the signal line can be selected.
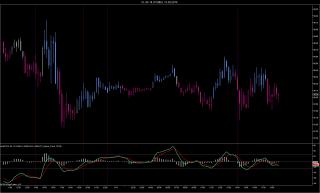
Histogram: The indicator has an option to plot a histogram, which shows the difference between DTI and signal line.
Trend definition: The indicator exposes the current trend via an IntSeries. The trend can be determined based on the DTI (rising & not oversold, falling & not overbought, neutral), the signal line (rising & not oversold, falling & not overbought, neutral)) or the DTI / signal line crosses. All trend definitions are not straightforward, but require a higher close to switch to an uptrend, or a lower close to switch to a downtrend. Moreover the DTI / signal line cross will only show an uptrend, when not oversold and a downtrend when not overbought.
Paint bars: The paintbars can be used to plot the trend information. The trend states are uptrend, downtrend and neutral trend as explained above. It is possible to apply the indicator to the price panel and unselect the indicator plots. This allows to use the indicator as a "paintbar only" indicator.
Sound alerts: The indicator comes with sound alerts which are triggered when the trend changes. The sound files are included with the zip file and should be manually copied into the directory Documents -> program files (x86) -> NinajTrader 7 -> sounds.
Update March 17, 2014: Option added to select sound files
Category NinjaTrader 7 Indicators
|
|
|


