Welcome to NexusFi: the best trading community on the planet, with over 150,000 members Sign Up Now for Free
Genuine reviews from real traders, not fake reviews from stealth vendors
Quality education from leading professional traders
We are a friendly, helpful, and positive community
We do not tolerate rude behavior, trolling, or vendors advertising in posts
We are here to help, just let us know what you need
You'll need to register in order to view the content of the threads and start contributing to our community. It's free for basic access, or support us by becoming an Elite Member -- see if you qualify for a discount below.
-- Big Mike, Site Administrator
(If you already have an account, login at the top of the page)
Todays Ichimoku....Obviously it dropped today, in my previous post I was hoping it would run up a little before this happened but....looking like the TS is going to cross the KS pretty soon so that indicate some more downside likely but we are still above the cloud so it remains "interesting".
Looking at the daily conventionally I'd like to see a pullback to about 709.5 for a short. 714ish could be another spot, hard to say but those spots are worth watching if they get visited.
Looking back at the chikou span, you can see it's on support from 26 periods ago.
Of course price is going to do whatever it wants regardless but that's not an ideal setup for Ichimoku.
Yes, with price on top of the kumo, the trend is bullish and if/when TS crosses below KS, it will
be considered a weak sell...watch for cloud support/reversion to the mean (KS).
Here's todays chart, nothing exciting to report Ichimoku wise.(refer to Massive's post above for what's might happen)
Just looking at it generally and seeing how things have been playing out I almost expect it to top out around the 698 level. I know that sounds wrong but as lame as the bulls have been I am not convinced the can go much higher but in case I'm wrong I would watch the 702 area should it get there. My official guess is the high will happen overnight...we'll see.
In fact, there are so many ugly charts right now that this could turn into one of those 15 page charting bonanzas of yesteryear, but in an effort to not go there � again � let�s focus on three risk asset charts that just look bad.
Starting out with the commodity complex, let�s take a look at crude with it having been tough to choose between it, copper, coffee, cotton and corn but with crude seeming likely to draw the most interest and after the four trading days, its daily chart suggests crude will be at $88/barrel in the not-so-distant future.
Its chart above is showing a bearish appendage pattern marked in purple to give it the benefit of the doubt of breaking to the upside on what could be a spiked bottom of some sort from yesterday. Should this unlikely bull case occur, the pattern needs to take crude above $100/barrel to confirm and something that may deliver crude to an upside target of about $105/barrel.
Turning to the more likely bear case of the bearish appendage pattern hanging from the Bear Flag Pole with it seeming that bear plus bear should equal at least one bear if not two bears, it confirms if crude crosses below $95/barrel and carries a target of $88/barrel.
Such a potential decline would take crude to the bottom of that Ascending Trend Channel as seems likely under the target-like pull of its lower trendline and such a drop could come quickly as in within a week or so.
Should crude drop by 10% in a week, it would seem to qualify as one of the uglier charts out there in risk asset land.
Turning to equities, let�s take a look at the sector that signaled yesterday�s equity index break was coming and this means, of course, the financials that had been trading in sympathy to the eurozone sovereign debt and banking crisis but may start heading lower on the Fed�s intentions to stress test a few of the big banks around that crisis.
Another possibility is a pop higher if investors digested that stress test exercise as a signal that the �situation� is under control and perhaps it will be soon, but the XLF is unlikely to use those two free-floating and bearish candles to reverse higher.
What would propel such a potential move up is a long shadowed candle with a short body on top and something that would serve as a Spike Bottom of sorts.
Might this happen tomorrow? It could if that spike down is put in with that Descending Triangle in purple wanting to pull the XLF down to about $11.50 before giving it a shot to move higher even though it seems that such a potential spike down might be put in somewhere between $11.50 and $12.00.
Either bottoming scenario is real enough whether it might come tomorrow, Friday or early next week and its hallmark sign will be a one-day deep decline with a close well off the low.
In the meantime, the XLF�s chart remains ugly until it finds support, if it finds support, between $11.50 and $12.00.
Lastly, let�s look at the Nasdaq Composite and this chart is so potentially ugly that it�s not even clear what to make of it exactly.
As you will see on the following page, its two-day free-floating Island is tough to assess with it seeming most likely that the Nasdaq Composite will somehow need to find a way to anchor those candles before a move higher is possible.
In looking at the index�s past trading history, such gaps up and down are typically a part of a multi-gap move and so perhaps the Nasdaq Composite will gap down again tomorrow before some sort of a Spike Bottom is put in and probably the only kind of bottom that could support a move back up.
In fact, even though its decline potential is less than that of crude with the Nasdaq Composite�s chart above talking about a move to some level between 2300 and 2400, its chart is ugly, really ugly. Oddly, it�s so ugly that from a technical standpoint it is almost beautiful in its own truly whip-sawing sideways way with it being unclear what move it might pull next.
When putting it together, however, will all of the other ugly charts that abound, it seems likely to produce a move down.
A Glimpse Into The Future Of The Stock Market And Dollar The "accident" many have been waiting for has finally happened, and it's called Europe. That doesn't bode well for the U.S. stock market. A lot of technical analysts and financial pundits are expecting a standard-issue Santa Claus Rally once a "solution" to Europe's debt crisis magically appears. There will be no such magical solution for the simple reason the problems are intrinsic to the euro, the Eurozone's immense debts and the structure of the E.U. itself.
We can fruitfully start a speculative look into the future of the U.S. stock market and dollar with a quote from John Mauldin's book Endgame: [COLOR=#1e439a]The End of the Debt Supercycle and How It Changes Everything[/COLOR]:
Economic theory tells us that it is precisely the fickle nature of confidence, including its dependence on the public�s expectation of future events, which makes it so difficult to predict the timing of debt crises. High debt levels lead, in many mathematical economics models, to �multiple equilibria� in which the debt level might be sustained �or might not be.
Economists do not have a terribly good idea of what kinds of events shift confidence and of how to concretely assess confidence vulnerability. What one does see, again and again, in the history of financial crises is that when an accident is waiting to happen, it eventually does. When countries become too deeply indebted, they are headed for trouble. When debt-fueled asset price explosions seem too good to be true, they probably are. But the exact timing can be very difficult to guess, and a crisis that seems imminent can sometimes take years to ignite.
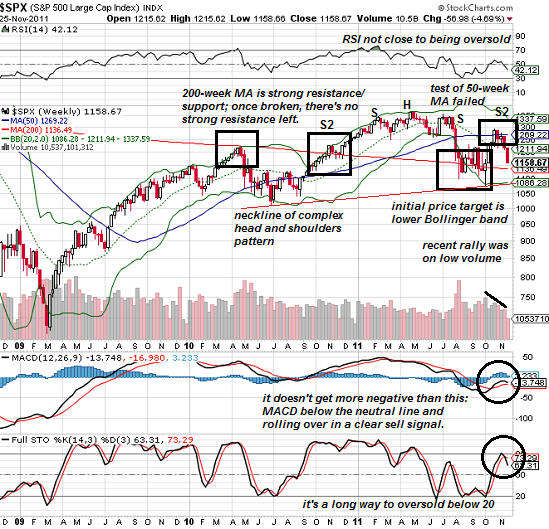
The accident has finally happened, and it's called the euro/European debt crisis. I see a lot of analysts trying to torture a Bullish interpretation out of the charts, so let's take a "nothing fancy" chart of the broad-based S&P 500 with five basic TA tools: Bollinger Bands to measure volatility, relative strength (RSI), MACD (moving average convergence-divergence), stochastics and volume.
If we use Technical Analysis 101 (basic version), a number of things quickly pop out of this chart--and none of them are remotely bullish.
1. This market is not even close to being oversold. Bulls are hoping that the selloff has created an extreme of negative sentiment, which would be a reliable indicator that the market is about to rally. But there is no evidence of such an extreme, and the VIX/VXO (not shown) is also not at an extreme.
Rather than an extreme of negative sentiment, we see complacency, and a long way down to reach extremes in RSI and stochastics.
2. The 200-week moving average (MA) has offered picture-perfect resistance and support. The entire August-September period of wild swings of volatility can be seen here as a struggle around the 200-week MA.
In a classic retracement, the SPX shot up and recovered the 50-week MA, but failed to hold that level. Now it is heading back down for another retest of the 200-week MA. Only this time the chart is significantly weaker than in September, and the low-volume "oversold/hopium" rally in October was technically underwhelming.
3. Another clue that supports the notion that the 200-week MA will fail to hold this next text is the beautiful (to technicians) complex head-and-shoulders pattern which is made up of a shallow HS triple top formed from March to August of this year, and a second outer left shoulder formed in November of 2010.
The corresponding right shoulder was traced by the October rally that just rolled over. This completes a long-term head and shoulders topping pattern.
4. The MACD is extremely negative, being well below the neutral line and rolling over into a bearish cross. Coincidentally, the stochastics also rolled over in a bearish cross.
5. Price tends to alternate between the Bollinger bands; rallies will rise to the upper band and push it higher, while declines will fall to the lower band and ride it down. Thus the lower band is a reasonable initial target for this decline. The problem for Bulls is that this target is well below the 200-week MA, meaning that hitting the lower band will mean the 200-week MA will be decisively broken.
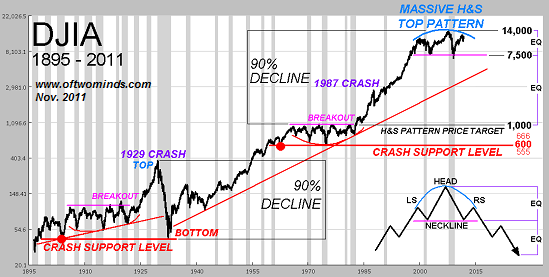
If price does fall to the lower band, we can anticipate an oversold rally back up to the 200-week MA, followed by a renewed plunge to new lows. An insightful technical analyst who prefers to be known only as "Chartist Friend from Pittsburgh" shared two very long-term charts of the Dow Jones Industrial Average (DJIA) and the U.S. dollar. As I have noted here many times, the current era has seen the DJIA and the dollar on a see-saw, meaning a falling dollar has corresponded to a rising stock market, and voce versa.
These charts are remarkably self-explanatory:
The implications of this chart are not exactly Bullish, as it targets a long-term bottom between 1,000 and 600.
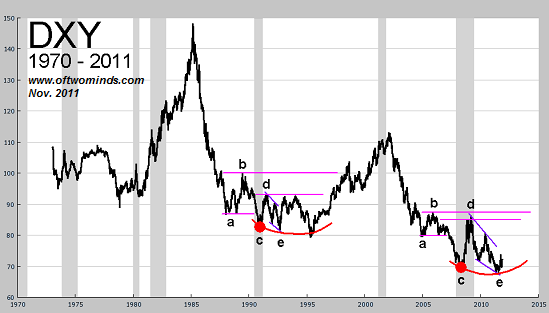
Turning to the U.S. dollar, our Chartist Friend observed, The monster decade long head & shoulders on the DJIA is well documented, but I have yet to see anyone other than myself make a connection between the DXY mid-90's bottom and the bottom that it is forming today."
Our Chartist Friend from Pittsburgh has noted how a classic 5-point pattern may be repeating, which targets the 86-88 level in the DXY near-term. Longer term, this chart suggests a rally of much greater duration and vigor than most analysts dare extrapolate in the current dollar-Bearish climate.
Here's a shot of todays chart, Ichimoku wise nothing exciting going on.
Looking at it conventionally you could say we have a reversal here...not real pretty but...
687.5 could be a nice spot for a shot at a long but could possibly drop to 682.5 to 683.5 area as well.
That being said I think it might actually go up to the 700 area from a touch off 695 and then drop..in which case I would want to play things differently.
Depending on where you draw fibs from, in one case anyway today it topped out at the 50% level so just have to see what happens.
On another note, I don't know about the rest of you guys/gals but the market sucks lately....don't like the PA and the way the order flow is. I am still doing alright but just don't like it, hope things change a little so I am more comfortable with it at least for a few days. We have expiration coming up and then christmas.....so we have to try to make the most of the good days because it's likely to be crap until the middle of January in my view(based on past experience).
Well clearly that wasn�t too painful for anyone who was long today, but now the question is whether today�s rally will reverse the recent rout in risk or serve as a signal of another stop down. Not having a crystal ball, let�s turn to the charts with most looking more bearish than not even with the distinct possibility of there being a little upside trading ahead.
Starting out with the intraday charts, the bull and bear battle here is the one pointed out ahead of the close and that is the distinction between an intraday Descending Trend Channel and an intraday Inverse Head and Shoulders pattern.
Clearly the Descending Trend Channel shown in the intraday chart of the DJIA to the right is a good bit simpler in its singular call for a decline than that of the daily Falling Wedge and intraday Inverse Head and Shoulders pattern marked up in the S&P to the left.
Interestingly, the best and only way to call the winner between the bullish IHS that will take equities 5% higher and the bearish Descending Trend Channel that will take equities 5% lower is the top trendline of the Channel. Should it be breached to the upside at 1199 on the S&P as a proxy for the other indexes and particularly on a convincing spike up, it should be taken as a very strong signal that the Falling Wedges will take the equity indexes 5% higher within days.
Should, however, the top Channel trendline continue to contain each of the equity indexes as was true today, then, there�s a pretty good chance the Descending Trend Channel will remain in effect for a 5% decline in the days ahead with this possibility appearing well-supported by the strong Bear Channels in small cap and the financials shown below.
In other words, the intraday charts seem to be more about those Bear Channels than the bullish Rising Wedge and IHS pattern combos but many a mid-move reversal has been staged on that latter mixture and so let�s take a look at the daily charts and limit it to the most bullish and the most bearish.
Interestingly and perhaps encouraging to the bulls, the most bullish looking daily chart is the sometimes-leading-Russell 2000 and the only index to have fulfilled its Symmetrical Triangle to the downside completely so far.
Perhaps offering it that more encouraging look is Friday�s low candle and something that could continue to propel a move up to help that potential IHS pattern confirm at about 800.
Oddly and probably not so encouraging to anyone wanting to feel good about equities is the daily chart of the DJIA.
Accounting for that bearish look is the Dow�s failure to take out Thursday�s high and a failure that set up the possible start of yet another Bear Pennant marked in purple and one that confirms at 11232 and carries a target of 10430.
Interestingly, beyond interestingly, in fact, is the fact that 10430 is very nearly the precise target of the bearish Rising Wedge in red.
Coincidence you ask? Well there is no such thing except for the mathematical kind when ��two expressions show a near-equality that lacks direct theoretical explanation�� and in that case, yes, it would seem to be a coincidence that the Dow�s new potential Bear Pennant carries the precise target of its bearish Rising Wedge born back in the beginning of October and one that might bring about the �near-equality� of those 10430 targets.
It seems, then, that one way to distinguish whether the bullish Falling Wedges or the bearish Descending Trend Channels will win in the very near-term is to watch whether today�s high in the Dow holds.
Should 11562 be breached to the upside, equities will probably bounce higher for at least a little bit. Should 11562 hold, there�s a chance things may get very bearish in a few days and perhaps for many days as in weeks if not longer.
And it would seem that the latter scenario would suggest that today�s relief rally will not reverse risk up.
No chart today...basically just garbage. Did get a couple trades but still don't like this stuff, the boat will be rocking tomorrow but would be on the watch for a trap of some kind. My thought is we will get a reaction at the 687 area or maybe 684.5 area(where it should go) but hard to say what .....