Welcome to NexusFi: the best trading community on the planet, with over 150,000 members Sign Up Now for Free
Genuine reviews from real traders, not fake reviews from stealth vendors
Quality education from leading professional traders
We are a friendly, helpful, and positive community
We do not tolerate rude behavior, trolling, or vendors advertising in posts
We are here to help, just let us know what you need
You'll need to register in order to view the content of the threads and start contributing to our community. It's free for basic access, or support us by becoming an Elite Member -- see if you qualify for a discount below.
-- Big Mike, Site Administrator
(If you already have an account, login at the top of the page)
Above consensus payroll numbers extended gains in equities as hope continued to spring eternal on Opening Day. Although, it was the first day of what is traditionally, a month associated with bullish seasonality (see below), there is cause for concern that Mr. Market may be pulling an April Fool's joke on all the bulls. The rally continues to be on waning volume and flat open interest, while the bond market appears to be pricing in an end to QE2, as the yield curve continues to flatten in expectation of the Fed’s need to control inflation. An end to QE2 and a subsequent tightening by the Fed would raise short term rates and as inflation concerns were abated, long term rates would fall, flattening the curve even more. While we have only one marker to compare where The Fed cut back on quantitative easing, the results are not confidence inspiring for the bulls. Post QE1, the S&P dropped from 1217 down to 1064, and commodities and crude were also hit hard, while rates rose. Is the economy strong enough this time around, to continue it’s “growth” without stimulus? Or does the Fed, extend the easing cycle with QE3 and we see $150.00 crude and $5+ gas at the pumps this Summer? I'm betting on the former, which is going to make me ever so vigilant of the possibility, that this April's market could be a contra-seasonal one.
Very light week as far as economic reports are concerned and earnings season is a week away
For now, equities are still a better place to be than cash, and the real momentum chasing may still be forthcoming in April. If the powers-that-be can manipulate an entire market, and engineer one of the greatest bull market rallies of all time, during a time when the economic fundamentals have been absolutely horrid, and global headline news is about one disaster after another, then yes, they just might be able to perpetuate the current asset inflation a little while longer. But they can only use the �forward looking� rationale for so long, before the laws of supply and demand catch up, and mete out economic justice, once again.
The ES presented an opening range trade with a very high probability of success due to a confluence of resistance at 1332.75 (HOD).
Chart 1 is a Fibonacci extension drawn from Friday's low to Friday's high to today's opening which resulted in a 23.60% Fib extension @1332. 45, which also coincided with the RTH only R1.
Chart 2 illustrates the +2SD from the VWAP@1332.75.
Chart 3 shows a falling $TICK and $ADD offering confirmation that market participants were selling into the rally.
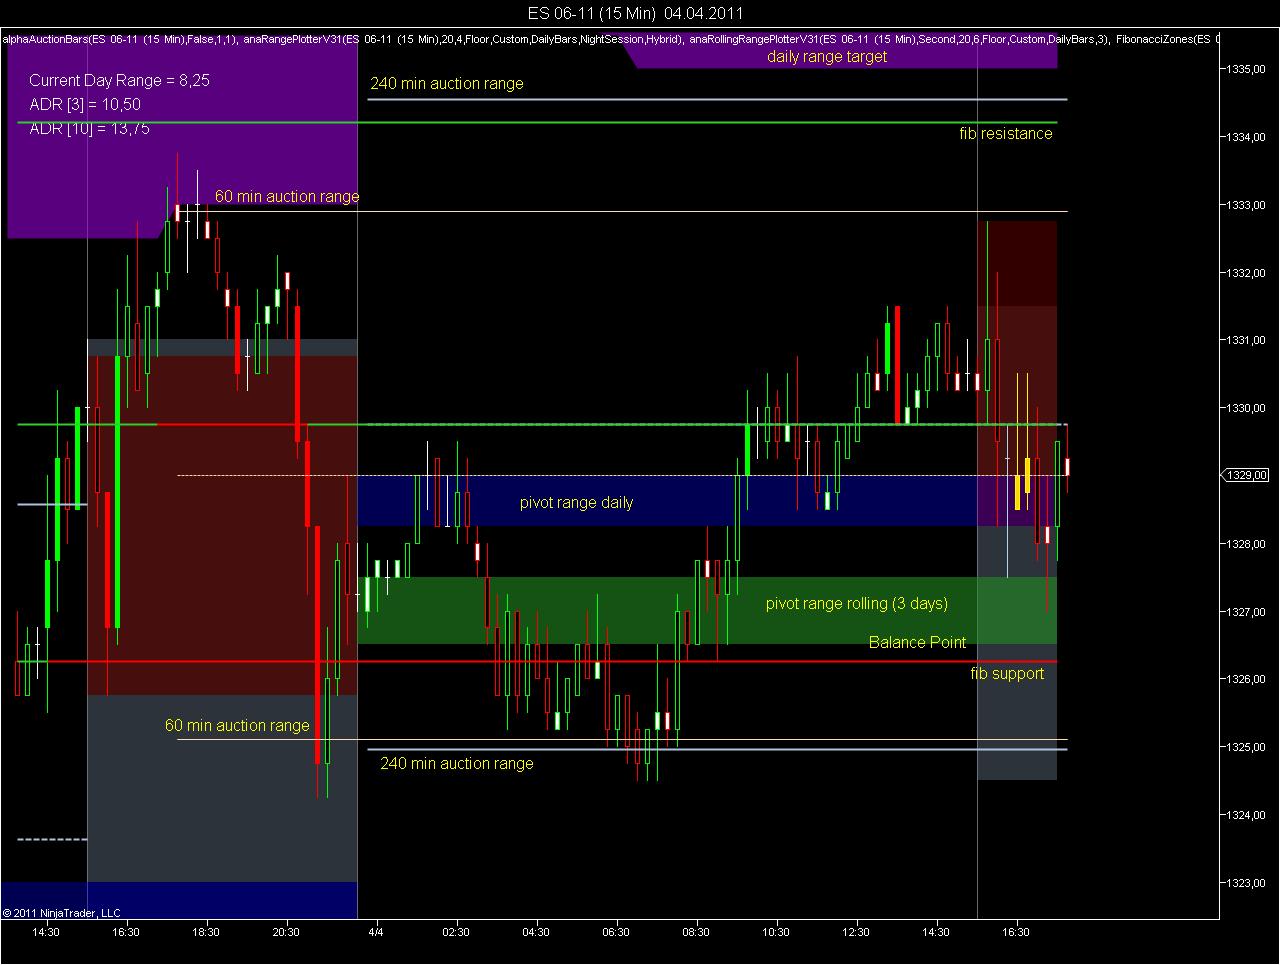
This is my picture for ES. Price action is a little above the pivot range and the rolling 3 day pivot range (which includes the balance point). This makes up for a slightly bullish to neutral picture.
There are several support zones around 1325 (auction range), 1326 (fib confluence and balance point). Resistance can be found around 1333 (60 min auction range) and 1334 (fib confluence and 240 min auction range).
If price breaks below 1325, the next stop would be around 1320.50.
Friday's Value Area High was 1333. Price opened within previous value area. Classical market profile theory states that responsive action should be expected hence the correct play was to fade Friday's VAH. Price tested 1332.75 before falling.
Good point! When the market opens within the value area, it is showing signs of a balanced market. Trading from a responsive versus initiative mind frame is the way to go
Add 1333.00 to the list! One more price level to join the confluence of points previously mentioned.