So I made some Matlab code and a GUI that looked at the tick-by-tick ES (e-mini S&P 500) data provided for Elite members here and did some curve fitting using 8 part Fourier Series.
Above just shows a look at data from 06/15/2009-06/18/2009. The first box next to the chart shows the 1st derivative of the fitted curve and the second box shows the 2nd derivative.
Any thoughts? Perhaps on-the-fly curve fitting could be implemented in a trade strategy, with a fast enough computer?
UPDATE: Also confidence is just R^2 for those who care. And does anyone else think the data is remarkably harmonic in the last hour?
The following 2 users say Thank You to tantrev for this post:
Fourier Analysis is useful, if you have a reason to believe that there are cyclical components in your time series and if you can identify the frequencies and eliminate the noise.
However, futures and stock prices mostly exhibit a non-linear behaviour, which means there are few such cyclical components to be identified.
If I look at your first chart, it shows a curve retro-fitted to data. At the right border - that is the place, where we want to predict price action and use the prediction for our trading - your curve exhibits a downward slope. If you please check what the market really did: it went up.
Curve fitting is a nice mathematical exercise. If you use a sufficient number of parameters, you can fit your curve to any past price action. But the curve has no predictive value. You can use it for interpolation but not for extrapolation.
Taking that data and drawing a simple trendline and wait until it is broken is more helpful. If you want to apply mathematics to trading, better look at volatility and autocorrelation than analyze supposed, but inexistant cyclical components.
There might by cyclical components in things affected by seasons, human-imposed or natural. Human-imposed would be futures rolls. Natural would be seasons.
In both cases that will involve looking at spreads.
Yes, of course there are natural and human cycles that do have an impact:
Day and night (as seen from the exchange where the instrument is traded): Participation (volume) and volatility during the night session is lower.
Weekly cycle: I have incorporated this cycle into my relative volume indicator by measuring the current volume against the average volume of the weekday.
Monthly cycle: Window dressing in the beginning of the month.
Yearly cycle: Seasonal impact for grain, energy. Tax season in May, etc.
If you talk about spreads, you are talking about agriculturals? I do not see many cyclical components in the note over bonds spread (as opposed to mean reversion, which can be assumed).
The following user says Thank You to Fat Tails for this post:
Fat i have a knowledge who uses this type of analysis (Fourier Analysis) to fine tune the parameters of his indicators and according to him this is the cream of the cream. For example, finding the optimal range per bar to use as interval for the ES or TF to name one. So to fine-tune our indicators would you consider it or do you think it's a lost of time ?
I agree with you when looking at big time periods but would you agree that on short time periods (~1 hr) there appears to be use for the fourier regressions?
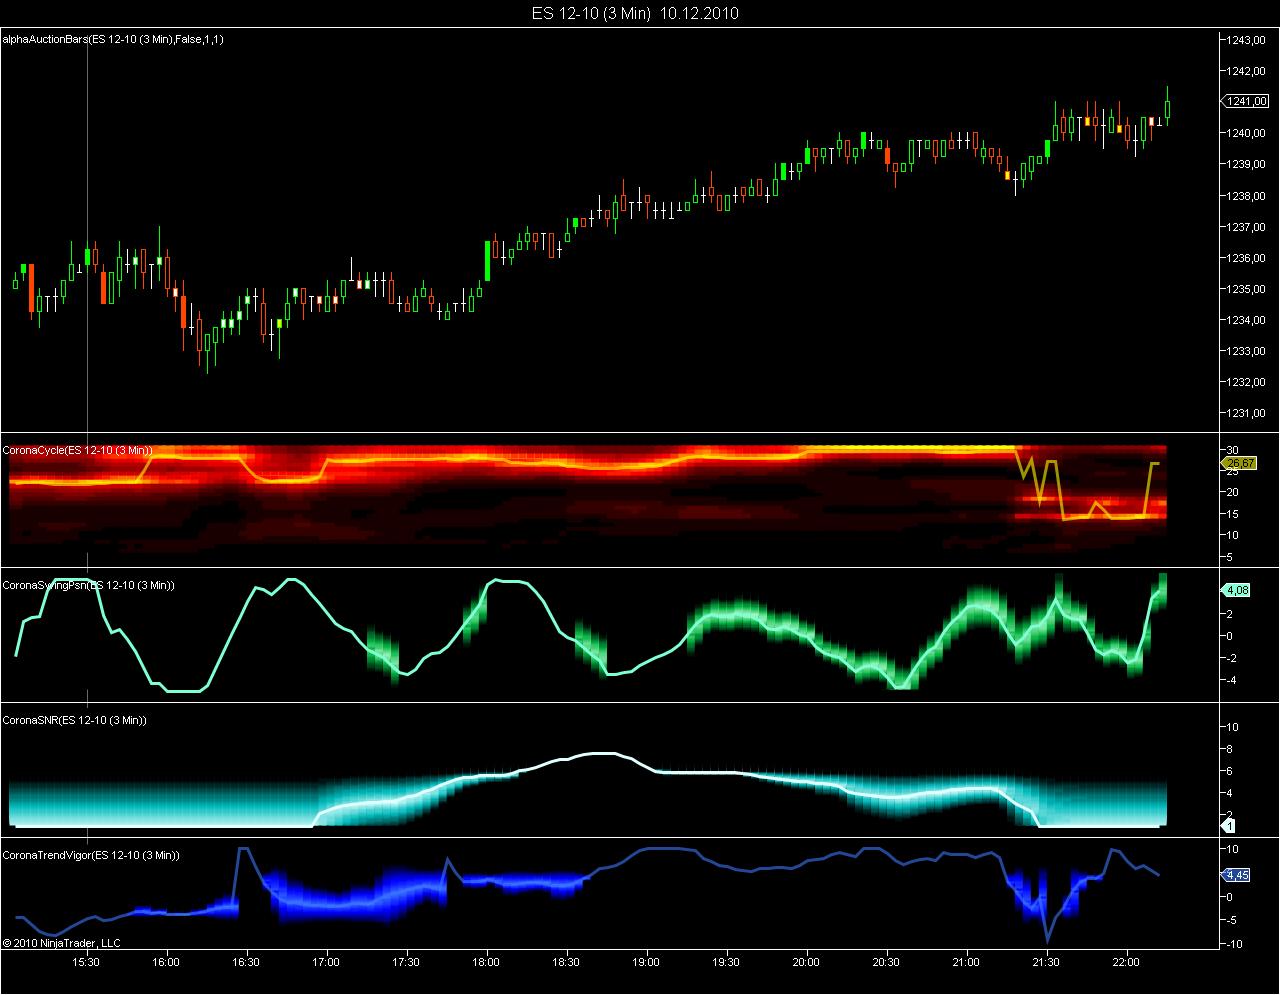
Not sure that a naked DFT will reveil much of a cycle. You could have a look at the Corona Indicators developped by John F. Ehlers. He detrends the time series before analyzing for cycles. I have put the indicators on a 3 min chart for ES for last Friday.
If you look at the cyclical component, there was a dominant cycle with a period of around 28 in the beginning of the session. The lows were tradeable because of the trend that developped later in the day, the highs predicted were not impressive. The problem here is that the cycle amplitude was too small compared to the noise. The signal-to-noise stayed below 4DB during the first two hours, with a large corona, which means that the cyclical signal was week and the noise dominant.
Also to note that the cyclical component, which can barely be identified within price action, changed its period during noon - increased period - and then again prior to the close of the session. if I take into account the daily volatility smile, it is possible that the cycle analysis works better on range charts than time based charts. This is what the shorter cycle in the beginning and the end and the longer cycle in the middle suggest.
But this is just one day of observation. I do not think that cycle analysis is an easy route to success. But it is the sexiest indicator I have ever seen.
Indicators courtesy of @sefstrat can be downloaded here. They work with both NT 6.5. and NT 7.0
This is a very general statement with no specific information. You could for example replace the word "FA" with the word "lap dance", and the whole thing still would make sense!
Even if we are not experts of Fourier and Hilbert transforms or Goertzel algorithms, there is nothing bad to try to improve our knowledge. I think the question is justified, whether methods developped be physicists and engineers can be easily applied to trading.
It is true that I understand little about the subject, but further learning would certainly overcharge my limited mathematical capabilities, so I am falling back to heuristics, thing most traders do, when faced with a complex situation. And my heuristics tells me that sentiment and correlations might be more important than assumed cycles.
The following user says Thank You to Fat Tails for this post:
Alas I think you have convinced me to avoid the stock market, haha. I suppose my dreams of sweeping in on the bottom of supposed cycles and coming out at the crest have been crushed (with good reason.)
Thank you for the technical response - it is nice to hear from an expert and I assure you that experts in this area are far and few in between (at least my limited experience has taught me so.)
Just to clarify for everybody else: Fourier Series and Fourier Transforms are two totally different things.
A Fourier series is just a function with a collection of these terms:
a1*cos(n*x) + b1*sin(n*x)
where if you keep going, my 8 part Fourier series would look something like this:
a1*cos(n*x) + b1*sin(n*x) + .... a8*cos(n*x) + b8*sin(n*x)
Now Fourier Transforms are ugly sons of bitches. I still don't completely understand them and I honestly don't think most people do. I know in about 3 lines of code, we used them to reconstruct raw MRI data from an MRI machine to the nice pictures you're used to seeing from MRI's but other than that it's kind of a mystery to me. I can tell you that if you have a sound signal, a Fourier Transform will show you the frequencies that are in the signal and their prominence.
The following 2 users say Thank You to tantrev for this post:
I am certainly not an expert. I am just suspicious. It is easy to give a meaning to any random set of data. If you flip a coin a thousand times, you will find cycles and trends, and it is all smoke and mirrors. Of course, there are real cycles that exist. The daily cycle that repeats itself, which affects volatility in the first place. There is a seasonal cycle, which is obvious for agriculturals and some energy products. Also there is a weekly cycle, which affects the behaviour of trades. The Monday night session typically has a higher volatility than the Tuesday night session, as the news of the weekend need to be digested. If there are cyclical patterns, you also may find them in high frequency analysis of trades.
But then I think that markets are less cyclical and more driven by non-linear dynamics. So the model that I have in mind is not the model of a pendulum, but a multi-agent model, where the agent's behaviour relies on feedback. Such a model can produce temporary oscillations (such as the hog or cattle cycle), but they are instable and dissolve. Timeseries of market data are non-stationary, probability distribution shift from Gaussian to non-Gaussian, when feedback reinforces.
I do not remember, where I have seen this model of a planetary motion with only three or four planets that looked cyclical but then suddenly one of the planets disappeared in outer space... the cyclical behaviour was just an illusion. I also like the Sugarscape simulation, it also shows pseudo-cyclical behaviour, before it drifts away.
The following user says Thank You to Fat Tails for this post:
Thanks for the great read thus far, yes I'm resurrecting an old thread.
The last post does well to explain the difference in Fourier Series (assumed cycles) and the Fourier Transform (which supposedly can be used on aperiodic waves).
I've been playing with these a bit, and believe it or not, at work the extremely awful Thomson Smart platform actually has indicators that utilize Fast Fourier Smoothing (ffS). There's also one called ffD which is described as "the exact analytical derivative of ffS." Unfortunately I would post screen shots but my work, at a financial firm no less, blocks me from accessing this site.
I've been looking at it for a few days now, and particularly smaller time frames. Mostly looking at CL just to see plenty of actions and trades. In that time frame, using it to trade, it's performing pretty well with the system I've developed (and rather quickly).
I'm still trying to recreate the indicators on a better futures trading platform since Thomson Smart is a black box and doesn't reveal coding. Here's what I know about it for sure:
ffS:
1. Uses the Fast Fourier Transfrom (FFT) to break the price "signal" into component sine waves, and translates that data into an array. That data now exists on the frequency domain, no longer on time.
2. ffS, somehow, identifies the first harmonic then depending on your input will keep the first X amount of harmonic frequencies, it then sets all other frequencies to zero.
3. The newly scrubbed frequency spectrum is translated back into the time domain via the Inverse Fourier Transform.
4. The result is a very smooth line (like a moving average) that tracks price. The fewer the harmonics you specify, the flatter the line.
Thus far I've been using the ffS as a filter to decide if long/short positions should be taken. An increasing 5 harmonic ffs means long is available. And vice versa.
ffD:
1. It says "exact analytical derivative" of ffS but I haven't worked out exactly what that means yet. It can be, at least crudely, reconstructed by taking ffs[0] - ffs[1].
I've been using ffD to determine preciesely when to enter trades.
There's some very glaring concerns for these to be fully deployed in a system though. Like, for example, these lines repaint. I know for some that is an instant dealbreaker, but to me, that just makes their value probabilistic instead of determined.
Just laying this out here in case this information is helpful. And if there's any MultiCharts .NET (c#) wizards out there interested in recreating these indicators for that platform, I'd love the help. I'm neither a mathematician nor a programmer naturally.
The following user says Thank You to BrianBacchus for this post:
1. Is the result of a Fourier Transformation a series of over-lapping waves of different amplitudes and frequencies?
2. What does, "That data now exists on the frequency domain, no longer on time." mean?
1. Yes. It breaks the price curve into its component waves. FFT supposedly allows an infinite number of component waves to be generated, I've generally seen most indicators limit the waves generated to ~50.
2. The FFT eliminates time as a datapoint. The result is a bunch of component waves. Graphed, the y-axis would be amplitude, the x-axis frequency. Like so:
Ehlers' code appears (I could be wrong) to merely record the "strongest" frequency on this plot and determine that as the price curve's "dominant cycle."
The smoothing technique I mentioned merely filters out the "weaker" frequencies to attempt to eliminate signal "noise." Noise in our case meaning outlier price swings that just juke the price action. It's unfounded if this is actually a valid technique, but the quick and dirty results I've used by paper trading it at work makes me think it warrants further study.
Furthermore, I've found a few academic papers that use FFT for data extrapolation. That's getting even further into the pipe dream, but could be really beneficial if the patterns hold, or at least give a good initial jump into the right direction. Here's the only financial indicator I've found that attempts to use FFT in this manner:
1. I think it would be interesting to see the component waves - like the top 5. plotted in a panel under the price action. The time axis is maintained then each wave would "start" at a different point, but then as each is a different length there will be times when the waves align, eg all peaking at about the same time, and at other times all troughing at together, and other times all perfectly out-of-sync times (peaks coinciding with troughs).
So rather than extrapolation I would like to see the waves and the price movement interaction.
Fwiw, I have something similar to that already. I tweaked Ehlers' code in the link below to plot his "Pwr" variable. It's annoying because it required loads of copy/paste to create 20 (there are 50 possible) plots for it. Not sure if we're supposed to post code in forums but I'll share if you're interested in seeing it in C#. It's by no means a completed work. Here's the paper from Ehlers:
He tries to use the Fourier Transform as a means to find dominant cycle, an approach that sounds like you might also be interested in seeing. He disregards FFT as an inferior approach to his own MESA research for determining dominant cycle (and therefore a self-setting and correcting indicator lookback period). For me, though, I'm looking at FFT as a noise reduction means.
Ehlers' other work has some pretty good merit. His Fisher Transform indicator is superb at detecting market turns, and there's an edge when instead of taking trading signals just from the turns, you wait for bullish/bearish divergences. It's a great base to build a strategy off of, it just needs some good filtering criteria:
I think many traders think that the market moves in cycles. After many many years of screen time, I've come to believe that the market moves in Waves like the ocean, rather than cycles. Cycles imply a fixed period. The period of the market is constantly expanding and contracting. (Like ocean waves).
Cycles do present themselves on occasion but are usually too short lived to be tradable, too short for daytrading anyway.
I talked to Mr. Ehlers many years ago and he told me that his cycle research came from his work in the oil industry. He then adapted it to the markets. (just a bit of trivia).
The following user says Thank You to sptrader for this post:
I agree with you that the lengths (and amplitudes) vary. When I was using the word "cycle" I did not mean to say the periodicity of the cycles was fixed (the lengths of the waves was fixed).
I do not think I have the correct language for it but I thought the Fournier process decomposed a composite wave into several component waves.
Here is what I am trying to express:
The blue line is the composite, The black line is the dominant cycle/wave, the red line is the secondary cycle/wave:
1. Yes you can post code.
However, it won't be any good to me as I'm not a programmer.
(In case you didn't know ninja trader indicators are written in C.)
Cutting and pasting wouldn't be any good for me time is a big limitation.
2. Detecting turns is what it's "all about" for me. As I mentioned I did download the Corona indicator package and one of the indicators is labeled the dominant cycle. (second one down - brown).
The concept the underlies the minor cycle / dominant cycle relationships that have been touched upon is the Summation Principle. If you want to play around with its application you can download this teaching tool made available by Alex McEachern, the founder of Power Standards Labs. https://www.powerstandards.com/resources/teaching-toy/ The one you'll want to play with is the Harmonics Primer. When I discovered this 'toy' a decade or so ago I had several conversations with Alex concerning wave theory. One of the comments he made which shaped my understanding of stock market cycle analysis is that when Fourier Analysis is applied to any numerical time series it will always find cycles. This does not mean that cyclicality is in fact present in the numerical time series. Or to express it differently, it does not mean that the cycles found have any useful application when it comes to trading. In my trading, which for 30 + years has been driven by the concepts put forward by J.M. Hurst, the only cyclicality that matters is that which you can see. Years past before the advent of HFT, cyclicality and dominant / minor cycle behavior was clearly present down to a 5 min duration. These days I have to focus on 3 hr and 6 hr time periods to find consistent behavior. Without this consistency, which Hurst calls persistance, you do not have predictability and a basis to have an expectation of a highly probably outcome.
With cyclic analysis it is tempting to become attached to time. It is more important to learn how to recognize the changes in price behavior that are consistent with the cycle turns you are expecting. It is this change in behavior that tends to occur at (some what) regular intervals that is the cycle. A simple example of this can be seen on a 60 min candlestick chart with a 24Hr time frame. Notice the pattern of higher lows/highs changing to a pattern of lower lows/highs. If you count the bars between the swing highs and the swing lows you will generally come up with an average of 6 bars. Six hrs.... the approximate session of a 24Hr market. If you can find your way into that hrly candle that is making that swing high or low and you have a reasonable expectation that you are in the time and place in which 6 hr cycle highs/ lows are typically made then you have a reason to make a trade. In the NQ, these swings are generally good for 50 points.
The following 3 users say Thank You to glennts for this post: