NexusFi: Find Your Edge


Home Menu


NQ footprint pattern


Discussion in Emini and Emicro Index

Updated
      Top Posters
    1. looks_one Quick Summary with 1 posts (0 thanks)
    2. looks_two tpredictor with 1 posts (0 thanks)
    3. looks_3 Jigsaw Trading with 1 posts (0 thanks)
    4. looks_4 brohnhdon with 1 posts (0 thanks)
    1. trending_up 2,586 views
    2. thumb_up 0 thanks given
    3. group 4 followers
    1. forum 3 posts
    2. attach_file 1 attachments


Search this Thread

NQ footprint pattern

  #1 (permalink)
 brohnhdon 
Columbus, OH
 
Experience: Advanced
Platform: NT8
Trading: ES, CL, GC, NQ, YM, RTY/TF/EMD, 6A/B/C/E/S
Posts: 57 since Jan 2017
Thanks Given: 0
Thanks Received: 22

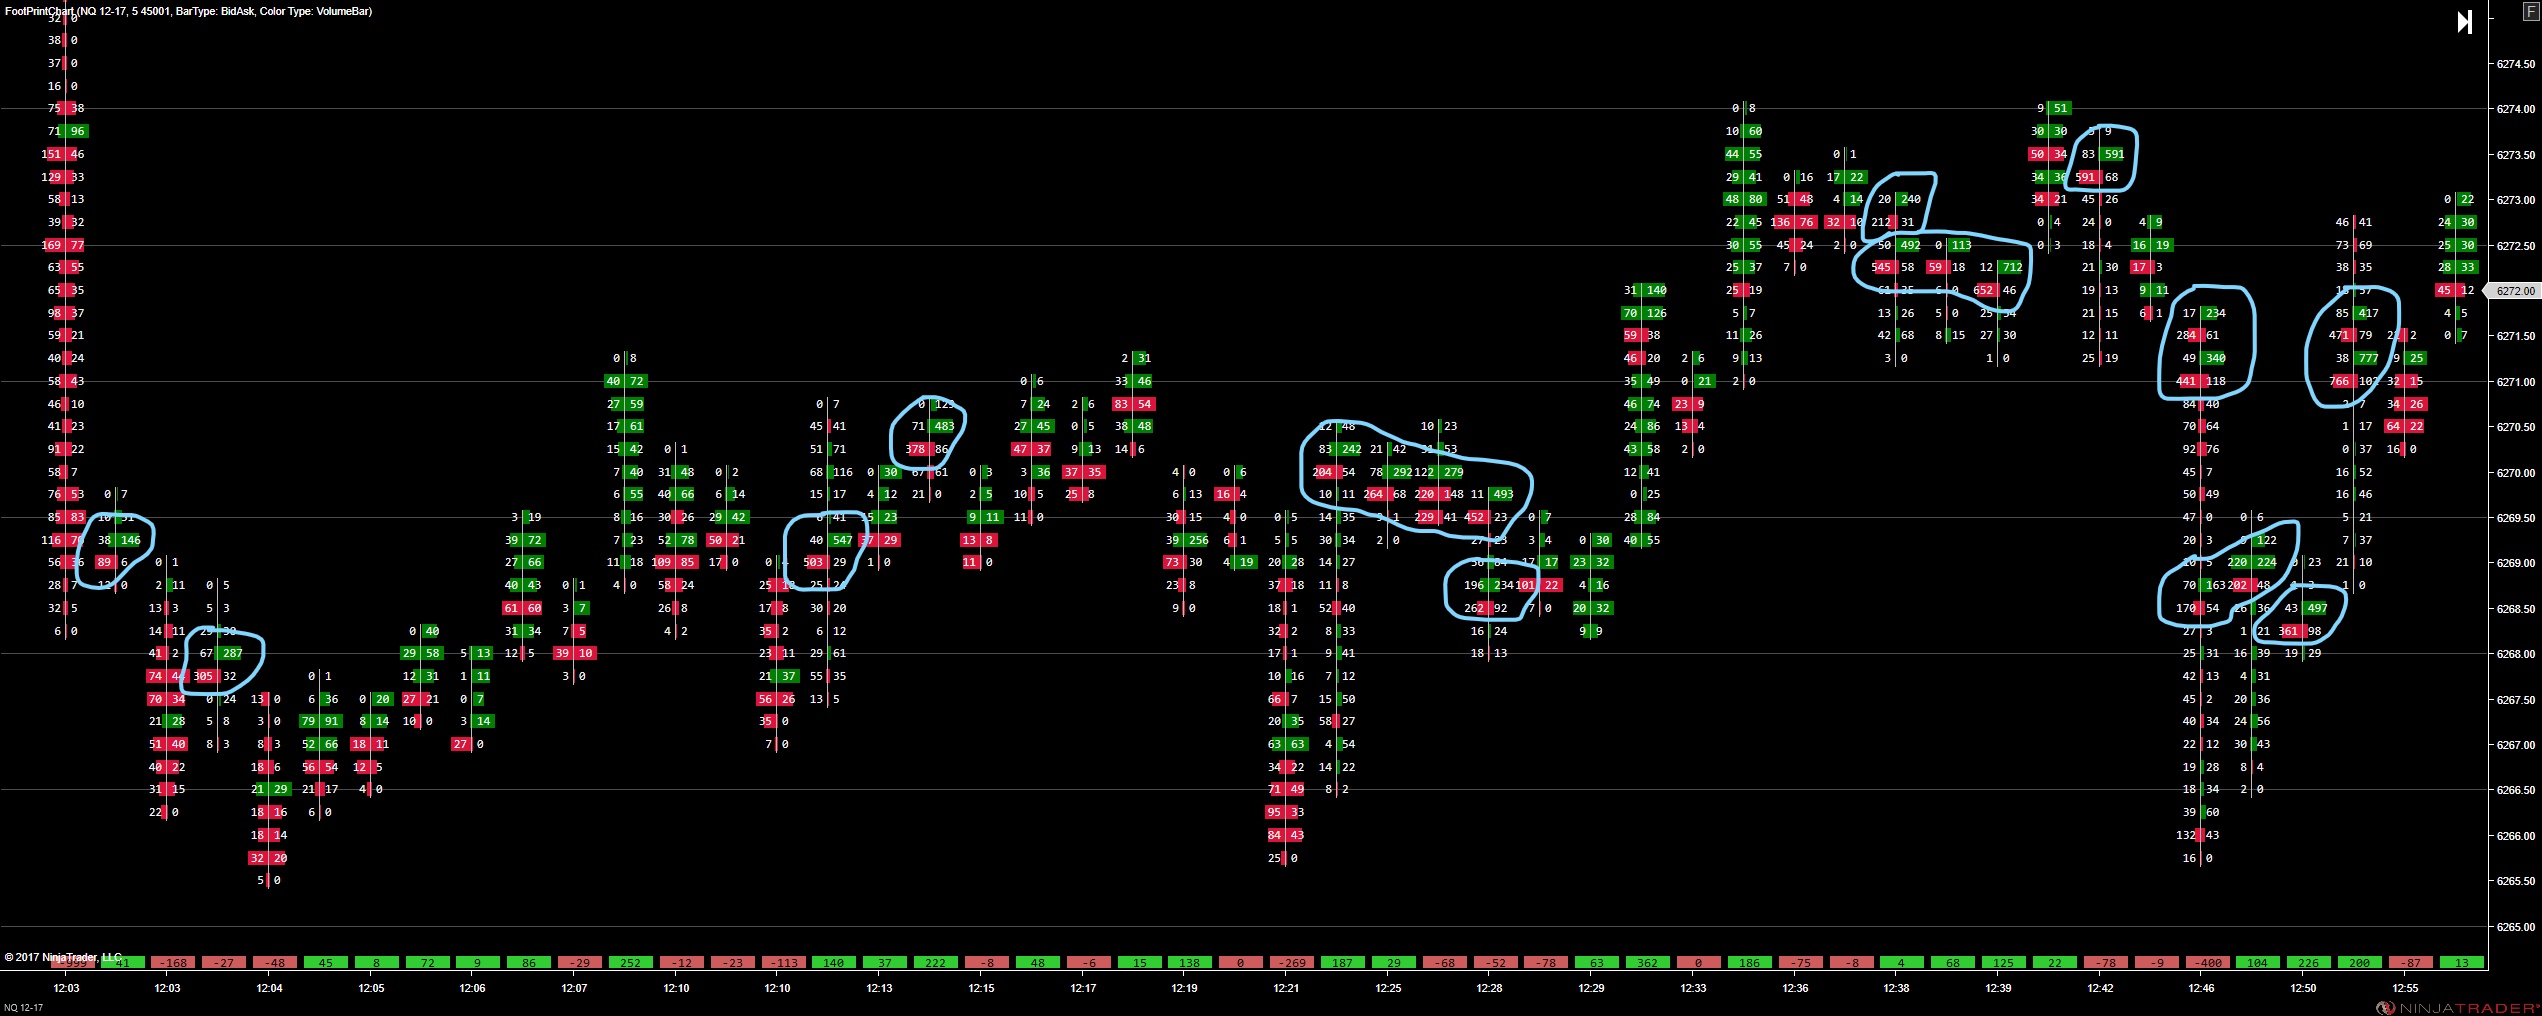
For footprint chart users, what is going on here? Apart from normal volume traded at the bid and ask, I see this pattern occasionally, especially in NQ futures; abnormally high volume at the inside bid and ask of roughly the same size. Are these spread trades being executed or what?


Visit my NexusFi Trade Journal Started this thread Reply With Quote

Can you help answer these questions
from other members on NexusFi?
How to apply profiles
Traders Hideout
ZombieSqueeze
Platforms and Indicators
Cheap historycal L1 data for stocks
Stocks and ETFs
Better Renko Gaps
The Elite Circle
Pivot Indicator like the old SwingTemp by Big Mike
NinjaTrader
 
  #3 (permalink)
 
Jigsaw Trading's Avatar
 Jigsaw Trading  Jigsaw Trading is an official Site Sponsor
 
Posts: 2,988 since Nov 2010
Thanks Given: 831
Thanks Received: 10,393


Usually just means the market is "spinning" there for a short period.

Lets say market moves up and a large offer iceberg is there, as traders buy into it - it'll build volume.

But that doesn't mean it's one sided, the other side will still be trading, so you'll see size on both sides.

If you have any questions about the products or services provided, please send me a Private Message or use the futures.io " Ask Me Anything" thread
Visit my NexusFi Trade Journal Reply With Quote
  #4 (permalink)
 tpredictor 
North Carolina
 
Experience: Beginner
Platform: NinjaTrader, Tradestation
Trading: es
Posts: 644 since Nov 2011

1. The answer is in the charts.
2. These charts are misleading.

What's missing here is the sequencing because I think these are volume charts right? In general when you get a lot of two sided trade it's because both buyers and sellers want to transact and there is liquidity to do so. It looks like in several places this is around the middle of the bar. On the other trades, the sequencing may not be showing what really happened unless you are using a resetting chart. Most of the footprint charts tabulate over time. So, you will notice in other places these occur at the edges of the range and that's probably because of the sequencing where stops were run and then buyers/sellers got aggressive and the market reversed.

Reply With Quote


Last Updated on February 27, 2018


© 2024 NexusFi™, s.a., All Rights Reserved.
Av Ricardo J. Alfaro, Century Tower, Panama City, Panama, Ph: +507 833-9432 (Panama and Intl), +1 888-312-3001 (USA and Canada)
All information is for educational use only and is not investment advice. There is a substantial risk of loss in trading commodity futures, stocks, options and foreign exchange products. Past performance is not indicative of future results.
About Us - Contact Us - Site Rules, Acceptable Use, and Terms and Conditions - Privacy Policy - Downloads - Top
no new posts