NexusFi: Find Your Edge


Home Menu


5 period Daily Moving Average in Multicharts


Discussion in EasyLanguage Programming

Updated
    1. trending_up 1,705 views
    2. thumb_up 0 thanks given
    3. group 3 followers
    1. forum 1 posts
    2. attach_file 1 attachments


Search this Thread

5 period Daily Moving Average in Multicharts

  #1 (permalink)
 ilu007 
New York + US
 
Experience: Intermediate
Platform: MultiCharts
Trading: Indian Stocks
Posts: 37 since Aug 2015
Thanks Given: 10
Thanks Received: 2

Dear Member,

I am trying to plot 5 period Simple DMA (Daily Moving Average) on 30-min time frame, but I am unsuccessful in doing so.
Also, If anyone could help me in drawing a simple trend recognition background.

If 30-min prices are below 5 DMA then the background color is Red.

If 30-min prices are above 5 DMA then the background color is Green.

If 30 min prices is above or below 5 DMA but didn't got out previous swing high/ low then color is yellow.

I am attaching a screenshot .
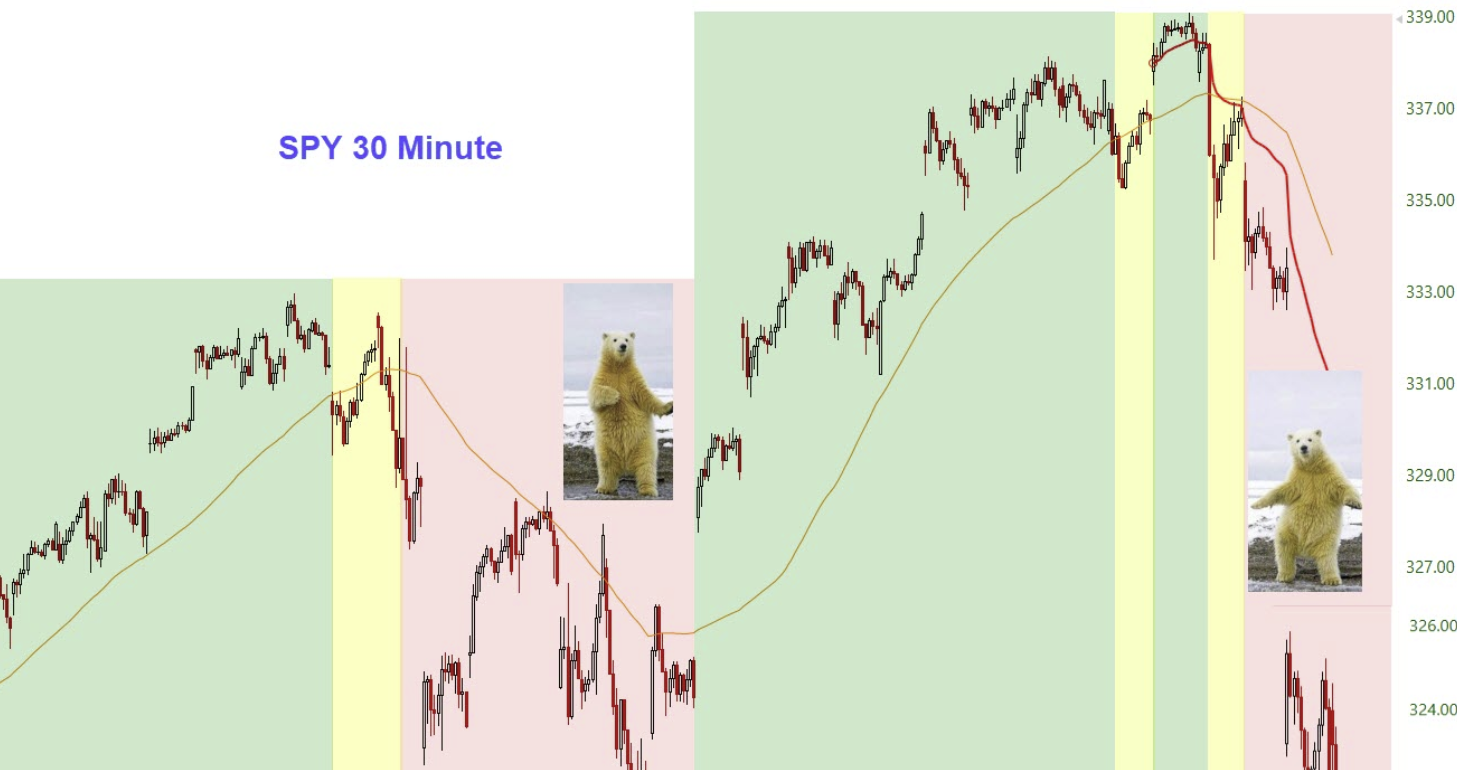
Started this thread Reply With Quote

Can you help answer these questions
from other members on NexusFi?
Trade idea based off three indicators.
Traders Hideout
MC PL editor upgrade
MultiCharts
Pivot Indicator like the old SwingTemp by Big Mike
NinjaTrader
Quant vue
Trading Reviews and Vendors
NT7 Indicator Script Troubleshooting - Camarilla Pivots
NinjaTrader


Last Updated on February 29, 2020


© 2024 NexusFi™, s.a., All Rights Reserved.
Av Ricardo J. Alfaro, Century Tower, Panama City, Panama, Ph: +507 833-9432 (Panama and Intl), +1 888-312-3001 (USA and Canada)
All information is for educational use only and is not investment advice. There is a substantial risk of loss in trading commodity futures, stocks, options and foreign exchange products. Past performance is not indicative of future results.
About Us - Contact Us - Site Rules, Acceptable Use, and Terms and Conditions - Privacy Policy - Downloads - Top
no new posts