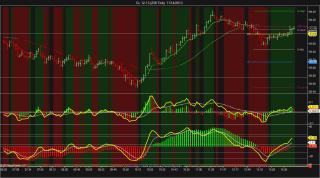
The signals are from the TSI Oscillator, Ergodic Oscillator, and MACD 3/10/16 oscillator.
Note: Momentum style trading systems do not perform well in trading ranges. If price action is trading within a trading range, do not trade this strategy. A filter can be added to require 32 SMA sloping or TSI above 0 before entry. This may eliminate chop but reduce potential profits.
Entries: 256 Chart
1. TSI Crossover (Ergodic 3,5,32, Main x Signal) - OR -
2. SMI Slope 5-32-3 - AND -
3. TSI Slope (5/32 with nested EMA 5) - AND -
4. TSI Slope (5/32 with nested EMA 5) (156 Tick Chart Settings)
Exits: 256 Tick Chart
1. anaTSI Crossover (3/7/14/3)
Discretionary trading signals
Take entries when SMI Slope and TSI Slope are in the same direction and the TSI Slope on the 156 tick chart is also in the same direction. Or, entries can be taken when TSI crosses its signal line.
Note the MACD 3/10/16 oscillator with MACD 32/5/5 histogram is included on the chart template. The MACD signals usually occur after the Ergodic oscillator signals, providing confirmation or allowing a late entry. The MACD histogram also provides good divergence signals. A third trend filter can be added to trade long when TSI is above zero line, or short when TSI is below zero line, but this will diminish profits and may cause entries near exhaustion for shorter moves.
Category The Elite Circle
|
|
|


