The Strategies
The strategies tested by the GlassBox are based on eight signals. Four of the signals are "fast" signals; four are "slow" signals. Each of these eight individual signals is itself a strategy, and by combining each fast signal with each of the four possible slow signals an additional sixteen combination strategies are generated.
Signal Inputs
Each of the eight basic signals has five potential inputs.
1) Indicator: The name of the indicator, with its parameters in parentheses.
2) Plot: If the indicator entered in (1) has multiple plots, the name of the plot used for the signal is entered here.
3) Slope Signal: If set to "true", the slope of the indicator plot selected in input (2) is used as the signal. A positive slope will trigger a long position, a slope of zero will signal a flat market position, and a negative slope triggers a short position.
4) Price Cross: If set to true, a long position will be triggered when price crosses above the indicator plot chosen in input (2). If price crosses below the indicator plot a short position will be triggered.
5) Cross Value: If neither the slope signal approach nor the price cross is chosen, the final option is the value cross. When the indicator plot chosen in input (2) crosses above the Cross Value a long signal is generated; when it crosses below a short signal fires.
Strategy Analysis Parameters
1) Trade Memory: The number of trades stored in memory for each strategy.
2) Minimum Bars: The minimum number of bars a trade must be active before it is stored in memory.
3) Target %P: The target percent profitable desired by the user. This is the percentage of the trades stored in memory that reach the Target MFE without going beyond the Target MAE.
4) Slippage: The slippage in ticks per turn used to adjust the Target MFE and Target MAE calculations.
Strategy Plot Parameters
1) Min MFE: The minimum Target MFE that a strategy must reach in order to be plotted.
2) Min MFE/MAE: The minimum Target MFE / Target MAE ratio required for a strategy to be plotted.
3) Plot Averages: If true, the Average MFE and Average MAE of the profitable trades will be plotted as triangles, but only for those strategies that meet the conditions set by Strategy Plot Parameters (1) and (2).
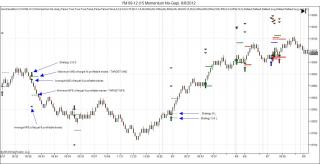
Strategy Plots
The GlassBox will plot entry signals that include an arrow on the entry bar, the Target MFE for the corresponding strategy, and the Target MAE for that strategy. If Plot Averages is set to true it will also plot Average MAE and Average MFE. The plots themselves are coded according to color (for fast signal strategies) and dash style (for slow signal strategies). This allows the user to identify the strategy that is signaling based on its plot.
Fast Signal Strategies
Indicator1 is red
Indicator2 is green
Indicator3 is blue.
Indicator4 is fuchsia
Slow Signal Strategies
Indicator5 is dashed
Indicator6 is dot
Indicator7 is dash-dot
Indicator8 is dash-dot-dot
Combination strategies can be recognized on the chart by combination plots. For example: a combination strategy involving Fast Signal 1 and Slow Signal 1 will be plotted as a red dash.
Signal plots will be removed from the chart if the signal condition fails to remain valid for the minimum bars set by the minimum bars parameter. A sound alert will play if an entry signal is removed from the chart to let the user know that the original signal is no longer valid.
For more a more detailed explanation and discussion visit this thread:https://nexusfi.com/elite-circle/22818-xavglassbox-discussion-automated-signal-analysis-discretionary-trading.html
Category The Elite Circle
|
|
|


