pls feel free to try with different instruments, timeframes, and provide feedback. (good & bad all welcome)...
full post where this started here
https://nexusfi.com/stocks-etfs-trading/21886-how-do-you-define-bullish.html
RedK
So what represnts an ideal trend, when is a "Full Trend Alignment" detected?
this is based on the calculation of an average "score" of price relative to 3 EMA's of different lengths, and of these EMA's each to the next longer one. to explain in chart terms: a full up trend is detected when the price (P, i use HLC3 by default) moves and stays above EMA10, AND the EMA10 crosses above EMA20 AND EMA20 crosses above EMA40. otherway around for an established down trend. now I don't have to plot all these EMAs on my price charts  . i can also add more weight to score of price action relative to fast EMA for reduced lag of signal . i can also add more weight to score of price action relative to fast EMA for reduced lag of signal
Note: the EMAs are hardcoded in the study. i set only one in the study settings, and then it takes half length of it as the faster EMA, and double length as the slower length .. i thought of making all 3 lengths adjustable from study settings, but preferred to keep this part simple. for bigger timeframe trend, i can set to 100, knowing it will take 50, 100 and 200 EMAs into the calc
Key changes for v4:
Simplify visulaization: removed vertical lines (found them nice but confusing), replaced with Chart Labels.
Better position decision making:
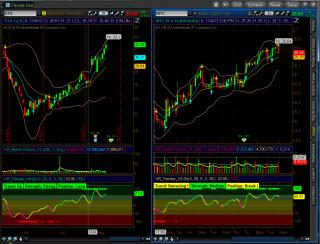
Added visual clue when a full trend alignment is detected (small green/red squares)
Chart Labels reflecting:- Trend Status Up, Down, or Retracing (Trend is slowing down or possibly reversing)
- Strength of price move: Weak, Medium, and Strong
- Position Recommendatoin: Long, Short, Break (this is where things get interesting. The position recommendation is made more strict. KR_Trender will only give a go "Long" or "Short" if a full trend alignment is detected (the Green/Red small squares) AND the move is sustained or getting stronger (in either directions up or down). otherwise, the recommendation is a "Break !" which means i should close the position, or add to it if other PA analysis tells me there's a chance of trend continuation.
Other changes:
exposed settings for desired Trend Level. i would keep it between 30 & 40, but you can try different values. also we still have an optional weight for score of fast price action relative to the 3 EMA's
Please do not share outside of BMT.. feel free to send me any feedback if you find this helpful in capturing trends (or not, or if you think i should simplify or add something i missed)
Category The Elite Circle
|
|
|


