5/23/2012: Moved ALGLIB routines to separate ALGLIB "Indicator". No functionality changes.
This is posted for BMT Elite Members Only. Please do not share or distribute.
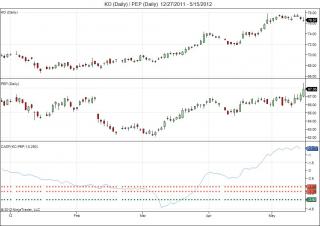
This indicator plots the augmented Dickey-Fuller statistic for residuals from a cointegrating regression. It can be used to show the probability that the prices of 2 instruments are "cointegrated". It would normally be used on daily data with a fairly long period.
It is based on (and was tested against) MATLAB code by James P. Lesage, posted at https://www.spatial-econometrics.com
Some numerical methods use code from ALGLIB (required ALGLIB "Indicator" included)
See https://www.alglib.net/
Recommended Reading: "Quantitative Trading" by Ernest P. Chan
also his blog at https://epchan.blogspot.com
The horizontal lines plotted by the indicator are the "Critical Values" for 1% (lowest line), 5% and 10% (highest line) levels. The indicator plots the statistic; lower values represent increasing likelihood of cointegration.
Category The Elite Circle
|
|
|


