Version 2.0 - in previous version, upon restart, the color selector parameters came up empty, in this version I made it so they default to Red, Yellow, and Green even if you had saved your workspace with other colors selected. I will keep investigating for a proper fix.
ColorInputSeriesSlopeChanges 1.0
I created a universal indicator that will alter the color based on slope change of "ANY" distinct, single-value dataseries in any panel. (I was reading Sharky�s thread and could not find the one he mentioned so I made one)
To use this, you need to learn how to define the input series for the indicator (all done via the NT7 UI). I created a thread in BMT that walks through this concept. You can also use NT7 help to learn how to do this.
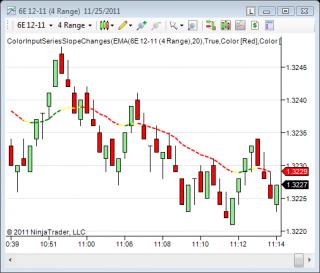
In the supplied screen shot, the default input series is the 6E 12-11 (4 Range. For the indicator I changed it to be the EMA(20).
You can use �ANY� other available dataseries as input and the color change will be applied. No programing required; upper Bollinger band, lower Keltner band, HMA, TSI, MACD, etc� any indicator you have on your system can be used as the input dataseries for this indicator.
You can change the colors used, the defaults are Red (down), Yellow(same or peak), or Green(up).
Yellow can indicate values that are identical but it can also represent what I call Peak. The Peak value is the bar that is the apex of the slope change (ie from up to down). You can also toggle the display of Peak off or on.
be happy to help, pm me
Category The Elite Circle
|
|
|


