-Works on SC versions in the 800s and later. Should also work in earlier versions. Does not currently work in the New Spreadsheets version.
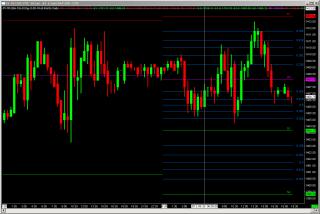
-This Sierra Chart spreadsheet study draws 5 fibs between pivots.
-It only uses whole pivots, no mid pivots.
-It displays 3 sets of 5 fibs; the middle set is between the pivots with the current price, the upper set is above the next upper pivot, the lower set is below the next lower pivot.
-The 3 sets will move together with the current price which will always be somewhere in the middle set.
-It will only draw the fibs of pivots for the current period. There are no historical fibs drawn. If you want to see historical fibs, scroll the chart into the past and go to Chart >> Replay Chart.
-When price is between R3 and R4 (or between S3 and S4), fibs will not display above R4 (or below S4). If price is above R4 (or below S4), no fib lines will display at all.
Instructions:
-Unzip the attached file, put the contents in your Sierra Chart \data folder.
-Focus your chart, click on Analysis >> Fibs of Pivots v2b-
-When asked 'Clear existing studies on chart?' , choose No.
-If necessary, add a pivot points study to your chart and, if you are NOT using another spreadsheet study on your chart, move the pivot points study to the first position in the Studies to Graph list.
-If you ARE using another spreadsheet study on your chart, do not move the pivot points study to the first position in the Studies to Graph list. Instead you'll have to locate the correct columns for each pivot then carefully and accurately edit the following cells to reference the pivots accordingly, using a row 3 reference of each column:
H11 = R4
H12 = R3
H13 = R2
H14 = R1
H15 = PP
H16 = S1
H17 = S2
H18 = S3
H19 = S4
-You can edit the values in cells H4-H8 to your fib% preferences, but each value should mirror the opposite %, as follows (see spreadsheet for example):
H4=1-H8
H5=1-H7
H6 should stay 50%
H7=1-H5
H8=1-H4
-It is recommended that you use the Fibs of Pivots v2b-.StdyCollct file because it loads the correct spreadsheet study and contains the correct settings.
-If you only use the Fibs of Pivots v2b.scwbf file, add the Spreadsheet Study study, name it Fibs of Pivots v2b in the Spreadsheet Name field, set the Chart Region to 1, set the Scale to Same as Region, check Draw Study Underneath Main Price Graph, set the Chart Data Output Sheet Number to 1, and move your Pivot Points study to the top of the Studies to Graph list.
Category Sierra Chart
|
|
|
