Ninja charts currently do not provide an automated method....(at least none I know of)....to set a 'visual scale' on Price.
Ninja allows manually scaling of the chart, but when price moves outside the desired range, Ninja requires you to..."click the F box"...in the upper left hand corner to regain scaling, and then repeat the manual process all over again. This means that when price narrows, the smaller swings take up the entire chart, causing small swings to visually appear the same size as larger swings....and causing small candles to elongate on the chart.
-----------------------------------------------------------------------
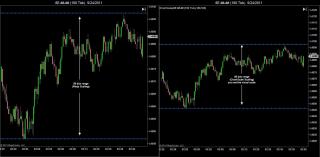
I have coded a very basic "scaling indicator" that will hold the Ninja charts in a desired tick range (y axis up-down). When price narrows, the chart scale will remain as you set it and the candlesticks will paint themselves showing visually appropriate swings. When/If price starts swinging significantly and moves outside of your scaled range, the indicator lets Ninja scaling take over...so price always remains within the bounds of your chart.
The ChartScale indicator automatically adjusts to any market "tick size"....and calculates the scaling range based on your settings...
- Lookback Period
- Desired # of ticks for right hand y axis
The indicator adds the appropriate amount of 'space' to the top and bottom of the chart when price narrows, maintaining a visual perspective that reflects the narrowed price swing.
NOTE: The 'blue lines' on the example are simply to help illustrate the comparison, they do not actually draw on the chart
Category NinjaTrader 7 Indicators
|
|
|


