Updated Version: 01.01.000 Updated: 04/11/2018
Named: fpgMultiREMAExtended
Enhancements
This version includes the previous bug fix and has several enhancements (some of which might have slipped into the previous fix release) as described below:
1. Reorganized the indicators parameters section
2. Version and release date included in the indicators parameters section
3. Changed the C-Rema and T-Rema OB and OS plots so that when they expand the new values are recorded immediately rather than waiting for a pull back. This results in the plot lines being a curve rather than being step-wise. However, because the OB/OS channel lines exactly match the C and T Rema plots they may be hidden until those plots pull back.
4. The OB and OS can be optionally and independently set to contract. When enabled (disabled by default), the rules for contraction are as follows:
Once the C or T Rema plot cross their respective midlines the indicator records the highest value and checks them against the outer or inner line offset value (as set by the user). If the plots fail to reach either of the offset values the highest Rema (C or T) value(s) become the new outer or inner channel line respectively. In the event of choppy plot lines, to avoid unnecessary changes the new outer or inner lines are not set until the Rema plot lines cross opposite the midline again, resulting in a step-wise contraction. All of the other lines are adjusted as required.
Updated Version: 04/09/2018, bug fix only
This version fixes a problem when the indicator is used with certain currencies. In these situations the various lines indicating Overbought and Oversold channels are not calculated. Because the OB/OS channel lines are not calculated the Breakout lines are not calculated either.
Note: If you are not having this problem then it isn't necessary to install this version as a new one will be out shortly that includes this fix and some new enhancements.
Release Data 3/21/2018
This indicator is an extension of the indicator found here. It was release separately rather than updating the existing one because of the experimental nature of some of the enhancements. These enhancements should be considered experiment because:
1. None of these enhancements were described in Ehler�s article, (this includes plotting the Cycle and Trend REMAs in the same panel as in the MultiREMA and using the crossing as a potential signal)
2. The value of them in trading has not been determined.
3. Although it has been tested with most all bar types most of the testing was done using only Renko bars (shown in the screenshot)
Note: The REMA indicator included is unaltered from the one installed with the MultiREMA and need not be installed again.
Enhancements
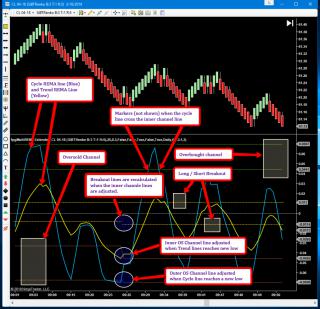
1. Dynamic Overbought (OB) and Oversold (OS) channel lines based on historical values with a midline for each
(disabled by default). Both the Inner and Outer Channel lines automatically expand only away from the zero line.
2. Short and Long Breakout lines as determined by the user (more below).
3. Optional markers indicate when the cycle RFEMA crosses (in both directions) the inner line of the Overbought or
Oversold channels.
4. Expose potential trade signal codes to IntSeries that identify Cycle/Trend line crossing.
5. Control of how/when to begin calculating the OB/OS lines. The default is �Daily� which causes the OB/OS lines to
be reset every new day at midnight (except for Sunday USA which happens at market open).
Descriptions
1. Expansion a. Dynamic OB and OS Channel Expansion. The outer line moves higher (lower) each time the Cycle Plot line attains a new higher (lower) value. b. The Inner channel works in a similar manner except the Trend Plot line is used rather than the Cycle Plot line. 2. Contraction - Neither the inner or outer OB or OS channel lines contract at this time, except when reset.
3. Breakout linesa. The Long and Short breakout lines are calculated using a user specified percentage and is the value of distance between the inner OB/OS line times a user specified percentage. b. Both the Long and Short breakout lines are calculated using the same percentage. c. The breakout lines are recalculated when the inner channel lines are adjusted. 4. Exposed Signals - A code is sent to an IntSeries when the Cycle REMA crosses the Trend REMA. Different codes
are used for the crossing depending on where the crossing occurred relative to the zero line.
Change Log Date Description 03/21/2018 Initial Release
03/22/2018 Correct Numbering in Indicator Parameters
04/09/2018 Correct problem calculating OB/OS channels for certain currencies.
04/11/2018 Enhancements as described above
Category NinjaTrader 7 Indicators
|
|
|


