NexusFi: Find Your Edge


Home Menu


EURUSD M6E/6E Euro


Discussion in Currencies

Updated
      Top Posters
    1. looks_one Big Mike with 402 posts (490 thanks)
    2. looks_two Cashish with 192 posts (162 thanks)
    3. looks_3 terratec with 117 posts (213 thanks)
    4. looks_4 rassi with 113 posts (110 thanks)
      Best Posters
    1. looks_one glennts with 1.9 thanks per post
    2. looks_two terratec with 1.8 thanks per post
    3. looks_3 Big Mike with 1.2 thanks per post
    4. looks_4 Cashish with 0.8 thanks per post
    1. trending_up 913,995 views
    2. thumb_up 3,050 thanks given
    3. group 204 followers
    1. forum 2,612 posts
    2. attach_file 1,255 attachments


Search this Thread

EURUSD M6E/6E Euro

  #561 (permalink)
r3algood
Little Rock, Arkansas
 
Posts: 198 since Jul 2011
Thanks Given: 106
Thanks Received: 109


Fat Tails View Post
I can easily top that chart.

Note the two strong orange and yellow lines on top. That is what I call resistance.

My god, it's full of stars...

Reply With Quote

Can you help answer these questions
from other members on NexusFi?
PowerLanguage & EasyLanguage. How to get the platfor …
EasyLanguage Programming
How to apply profiles
Traders Hideout
Exit Strategy
NinjaTrader
NT7 Indicator Script Troubleshooting - Camarilla Pivots
NinjaTrader
Trade idea based off three indicators.
Traders Hideout
 
Best Threads (Most Thanked)
in the last 7 days on NexusFi
Spoo-nalysis ES e-mini futures S&P 500
29 thanks
Just another trading journal: PA, Wyckoff & Trends
25 thanks
Tao te Trade: way of the WLD
24 thanks
Bigger Wins or Fewer Losses?
21 thanks
GFIs1 1 DAX trade per day journal
16 thanks
  #562 (permalink)
 
rassi's Avatar
 rassi 
the congo
 
Experience: Advanced
Platform: North sea oil rig
Trading: Cl
Posts: 927 since Jun 2009
Thanks Given: 1,563
Thanks Received: 1,199


Fat Tails View Post
How did you anticipate that expected area of demand, what tools did you use to detect it?

Fibs and some PPA

I was out at the time nut my reasons for closing and opening the long are shown here.

Attached Thumbnails
Click image for larger version

Name:	euarea.PNG
Views:	164
Size:	105.9 KB
ID:	52289  
Visit my NexusFi Trade Journal Reply With Quote
Thanked by:
  #563 (permalink)
 
Zwaen's Avatar
 Zwaen 
Netherlands, Blaricum
 
Experience: Intermediate
Platform: Excel, Python, R
Broker: IB
Trading: Options
Posts: 250 since Dec 2010
Thanks Given: 848
Thanks Received: 238


rassi View Post
Fibs and some PPA

I was out at the time nut my reasons for closing and opening the long are shown here.

Wasn't it just because this level got tested twice on 14th (resistance) and tested again as the low in the asian session (support)?
Or do you also want confluence with fib zones?

Attached Thumbnails
Click image for larger version

Name:	g5.JPG
Views:	162
Size:	150.6 KB
ID:	52291  
Reply With Quote
Thanked by:
  #564 (permalink)
 
rassi's Avatar
 rassi 
the congo
 
Experience: Advanced
Platform: North sea oil rig
Trading: Cl
Posts: 927 since Jun 2009
Thanks Given: 1,563
Thanks Received: 1,199


Zwaen View Post
Wasn't it just because this level got tested twice on 14th (resistance) and tested again as the low in the asian session (support)?
Or do you also want confluence with fib zones?

Must have confluance. But the pa was as i have annotated on your chart.

Attached Thumbnails
Click image for larger version

Name:	zween.PNG
Views:	164
Size:	510.4 KB
ID:	52292  
Visit my NexusFi Trade Journal Reply With Quote
Thanked by:
  #565 (permalink)
Retro
Chicago, Illinois, USA
 
Posts: 19 since Oct 2011
Thanks Given: 0
Thanks Received: 3

I have a few forex trading strategies that I've been back-testing and trading for the past several months, all of them are very bearish on the EUR for the short term. Just my 2 cents..

Reply With Quote
  #566 (permalink)
 
Big Mike's Avatar
 Big Mike 
Manta, Ecuador
Site Administrator
Developer
Swing Trader
 
Experience: Advanced
Platform: Custom solution
Broker: IBKR
Trading: Stocks & Futures
Frequency: Every few days
Duration: Weeks
Posts: 50,442 since Jun 2009
Thanks Given: 33,215
Thanks Received: 101,603

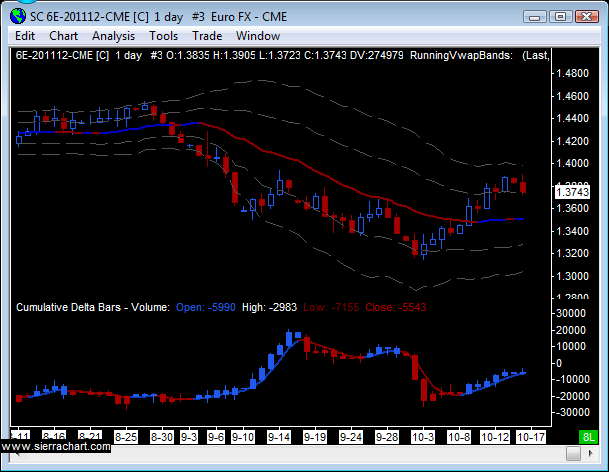
Daily. Continued divergence, near monthly outer SD VWAP band, failure to make new highs above September 14 high.


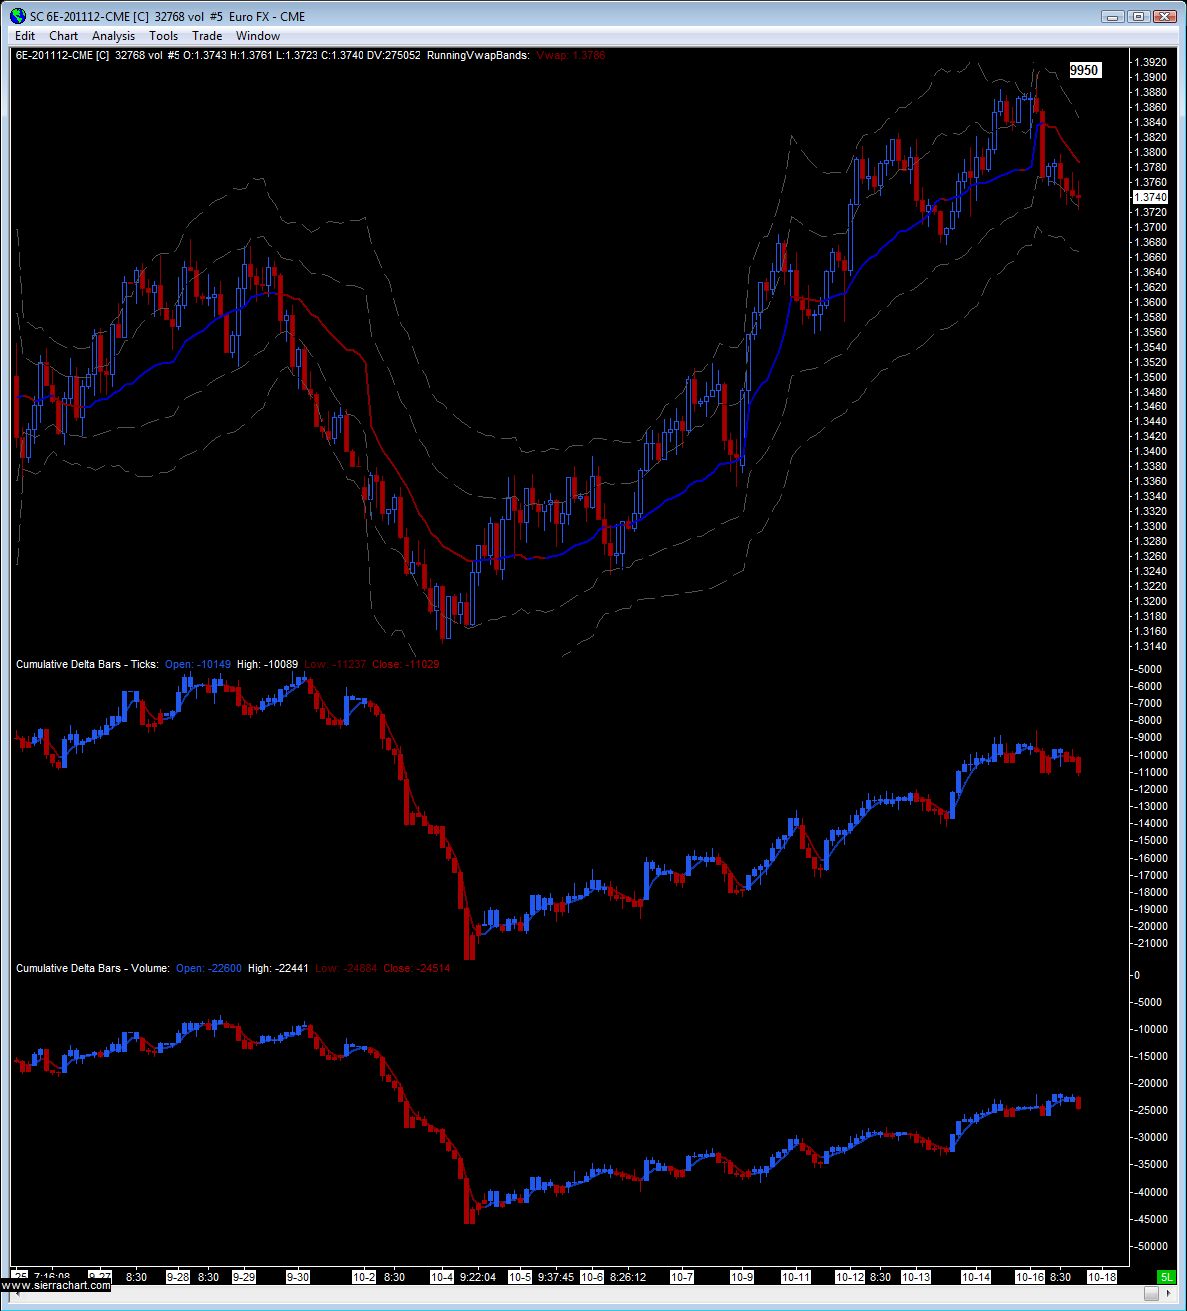
Medium chart. Chart is still more bullish than it is bearish. Delta is virtually sideways with no real conviction either direction. Need to either see a test of 3900's fail again to start feeling more bearish, or need to see a breakdown below 3500. This is relative to this particular chart, and has a big offset simply because of the huge 9 day rally we had moving the market over 700 ticks. It is likely we will see less volatility than that in the short term, so a smaller chart may be needed.


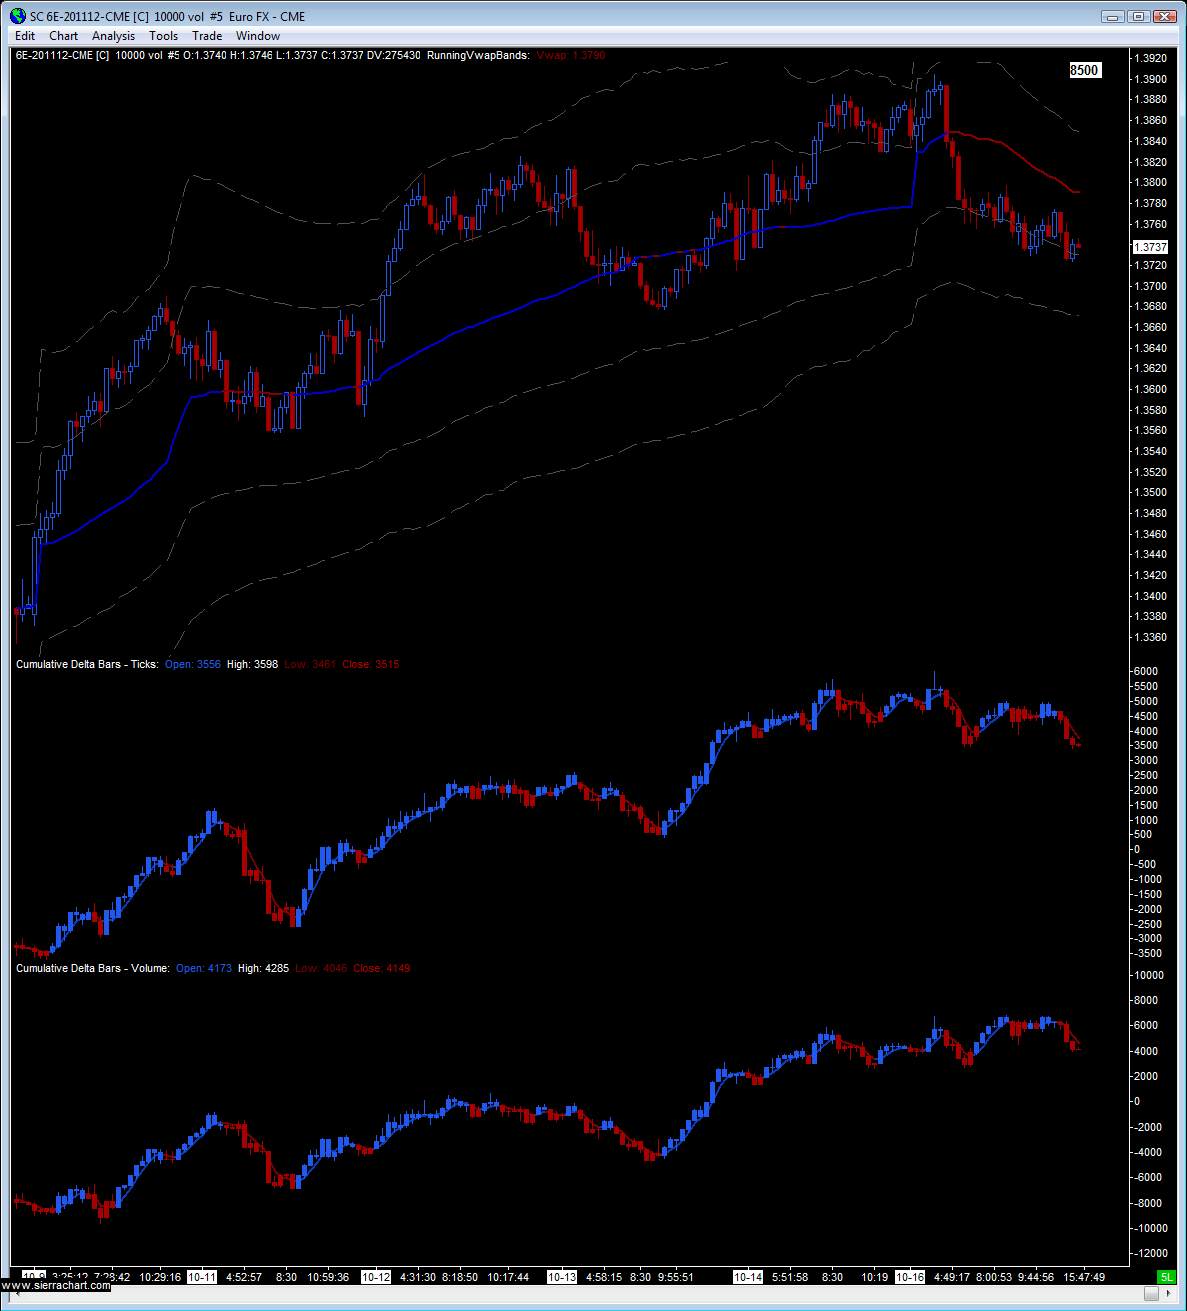
Small chart. Here we're looking at 1 week of price movement, and see that we recently have changed the direction of the trend from bullish to bearish -- provided the movement we saw today is sustained into tomorrow.


Mike

We're here to help: just ask the community or contact our Help Desk

Quick Links: Change your Username or Register as a Vendor
Searching for trading reviews? Review this list
Lifetime Elite Membership: Sign-up for only $149 USD
Exclusive money saving offers from our Site Sponsors: Browse Offers
Report problems with the site: Using the NexusFi changelog thread
Follow me on Twitter Visit my NexusFi Trade Journal Started this thread Reply With Quote
  #567 (permalink)
 terratec 
Zurich Switzerland
 
Experience: Intermediate
Platform: NinjaTrader
Broker: IB
Trading: ES, 6E, CL
Posts: 403 since Sep 2009
Thanks Given: 64
Thanks Received: 515

Fridays low 3712 did hold overnight.
3680 as important sup level.
ZEW data this morning as a possible mover.

Attached Thumbnails
Click image for larger version

Name:	11 10 18 0000.png
Views:	141
Size:	21.9 KB
ID:	52361   Click image for larger version

Name:	11 10 18 0001.png
Views:	122
Size:	16.5 KB
ID:	52362  
Reply With Quote
Thanked by:
  #568 (permalink)
 
Private Banker's Avatar
 Private Banker 
La Jolla, CA
 
Experience: Master
Platform: Sierra Chart, X_Trader Pro, OptionsCity
Broker: Advantage, Trading Technologies, OptionsCity, IQ Feed
Trading: CL, NG
Posts: 1,038 since Jul 2010
Thanks Given: 1,713
Thanks Received: 3,863

Uh oh... Could this be a sign? (Orange circle) Lol!

Attached Thumbnails
Click image for larger version

Name:	6E 12-11 (5 Min) 10_18_2011.jpg
Views:	196
Size:	235.7 KB
ID:	52386  
Reply With Quote
Thanked by:
  #569 (permalink)
 
Big Mike's Avatar
 Big Mike 
Manta, Ecuador
Site Administrator
Developer
Swing Trader
 
Experience: Advanced
Platform: Custom solution
Broker: IBKR
Trading: Stocks & Futures
Frequency: Every few days
Duration: Weeks
Posts: 50,442 since Jun 2009
Thanks Given: 33,215
Thanks Received: 101,603


Private Banker View Post
Uh oh... Could this be a sign? (Orange circle) Lol!

Momentary blip, I believe we will close lower today, tomorrow, this week.

Mike

We're here to help: just ask the community or contact our Help Desk

Quick Links: Change your Username or Register as a Vendor
Searching for trading reviews? Review this list
Lifetime Elite Membership: Sign-up for only $149 USD
Exclusive money saving offers from our Site Sponsors: Browse Offers
Report problems with the site: Using the NexusFi changelog thread
Follow me on Twitter Visit my NexusFi Trade Journal Started this thread Reply With Quote
Thanked by:
  #570 (permalink)
 
David_R's Avatar
 David_R 
San Jose, Ca
Legendary Market Wizard
 
Experience: Beginner
Platform: Ninja
Broker: AMP/CQG
Trading: Something moving
Posts: 1,582 since Nov 2009
Thanks Given: 2,335
Thanks Received: 2,524


One uptrend line has been broken, but another below it is still in place. That TL comes in at around 1.3600.


Seems like mixed info. There was SOT at the highs an we have sold off, but there is SOT on the small downtrend channel as well and we may have sprung from the 1.3650 area. Does not mean new highs, but the potential is there.

SOT=Shortening of the thrust. Price unable to reach the opposite trend line of the channel.


D

Attached Thumbnails
Click image for larger version

Name:	2011-10-18_09-48_E6Z.jpg
Views:	146
Size:	74.7 KB
ID:	52406  
Visit my NexusFi Trade Journal Reply With Quote
Thanked by:


Last Updated on January 27, 2024


© 2024 NexusFi™, s.a., All Rights Reserved.
Av Ricardo J. Alfaro, Century Tower, Panama City, Panama, Ph: +507 833-9432 (Panama and Intl), +1 888-312-3001 (USA and Canada)
All information is for educational use only and is not investment advice. There is a substantial risk of loss in trading commodity futures, stocks, options and foreign exchange products. Past performance is not indicative of future results.
About Us - Contact Us - Site Rules, Acceptable Use, and Terms and Conditions - Privacy Policy - Downloads - Top
no new posts