Welcome to NexusFi: the best trading community on the planet, with over 150,000 members Sign Up Now for Free
Genuine reviews from real traders, not fake reviews from stealth vendors
Quality education from leading professional traders
We are a friendly, helpful, and positive community
We do not tolerate rude behavior, trolling, or vendors advertising in posts
We are here to help, just let us know what you need
You'll need to register in order to view the content of the threads and start contributing to our community. It's free for basic access, or support us by becoming an Elite Member -- see if you qualify for a discount below.
-- Big Mike, Site Administrator
(If you already have an account, login at the top of the page)
Bitcoin Price Analysis: BTC/USD Bulls Keep Charging to Upside Targets
Ripple price declined further below the $0.3040 and $0.3000 support levels against the US dollar.
The price remained in a bearish zone below $0.3200 as discussed in yesterday�s analysis.
There is a major bearish trend line in place with resistance at $0.3060 on the hourly chart of the XRP/USD pair (data source from Kraken).
The pair could correct higher in the short term, but it is likely to decline further towards $0.2850.
Ripple price extended losses and broke key supports against the US Dollar and bitcoin. XRP is currently in a bearish zone and it could continue to move down towards $0.2850 or $0.2820.
Ripple Price Analysis
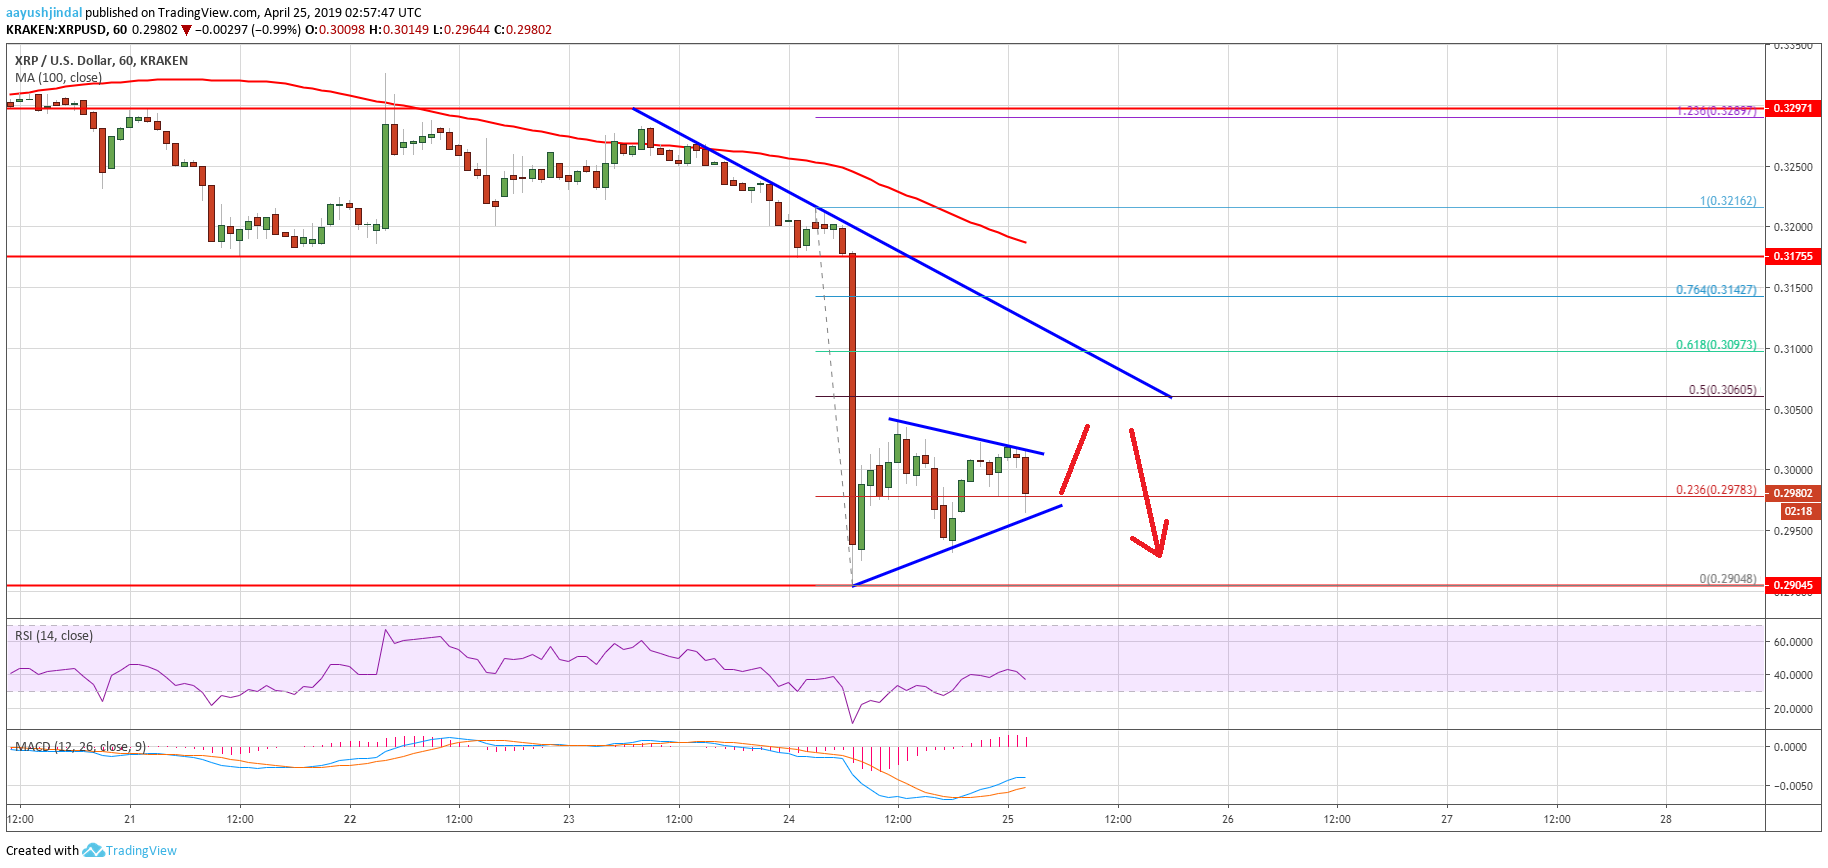
Yesterday, we saw the start of a strong decline from the $0.3300 resistance area in ripple price against the US Dollar. The XRP/USD pair declined sharply below the $0.3250 and $0.3220 support levels. There was even a close below the $0.3200 level and the 100 hourly simple moving average. A swing low was formed near $0.3175 and later the price corrected higher. It moved above $0.3200, but it failed below the 50% Fib retracement level of the drop from the $0.3288 high to $0.3175 low.
As a result, there was a fresh decline below the $0.3175 support area (as discussed in yesterday�s analysis). There was a sharp decline below the $0.3100 and $0.3040 support levels. The price even broke the $0.3000 support to register more than 10% intraday drop. It traded close to the $0.2900 level and a swing low was formed at $0.2904. At the moment, the price is consolidating losses above the $0.2910 level. It recovered above the 23.6% Fib retracement level of the recent drop from the $0.3216 high to $0.2904 low. On the upside, there are many hurdles near the $0.3050 and $0.3060 levels.
There is also a major bearish trend line in place with resistance at $0.3060 on the hourly chart of the XRP/USD pair. The trend line coincides with the 50% Fib retracement level of the recent drop from the $0.3216 high to $0.2904 low. Therefore, it won�t be easy for the bulls to push the price above the $0.3050 and $0.3060 resistance levels.
Ripple Price Analysis XRP Chart
Looking at the chart, ripple price is clearly under a lot of bearish pressure below $0.3100 and the 100 hourly SMA. There is a risk of more losses below the $0.2900 support levels. Sellers may push the price towards $0.2850 or even $0.2820.
Technical Indicators
Hourly MACD � The MACD for XRP/USD could move back in a bearish zone in the short term.
Hourly RSI (Relative Strength Index) � The RSI for XRP/USD is currently well below the 50 and 40 levels.
Major Support Levels � $0.2900, $0.2850 and $0.2820.
Major Resistance Levels � $0.3050, $0.3060 and $0.3070.
Can you help answer these questions from other members on NexusFi?
There was a strong decline in bitcoin price below the $5,280 support level against the US Dollar.
The price even spiked below the $5,000 support level and it is currently consolidating above $5,100.
There is a major bullish trend line in place with support at $5,080 on the 4-hours chart of the BTC/USD pair (data feed from Kraken).
The pair could bounce back as long as there is no weekly close below the $5,000 support level.
Bitcoin price started consolidating losses after a strong decline against the US Dollar. BTC is likely to recover above $5,200 and $5,280 in the near term unless the $5,000 gives way.
Bitcoin Price Weekly Analysis (BTC)
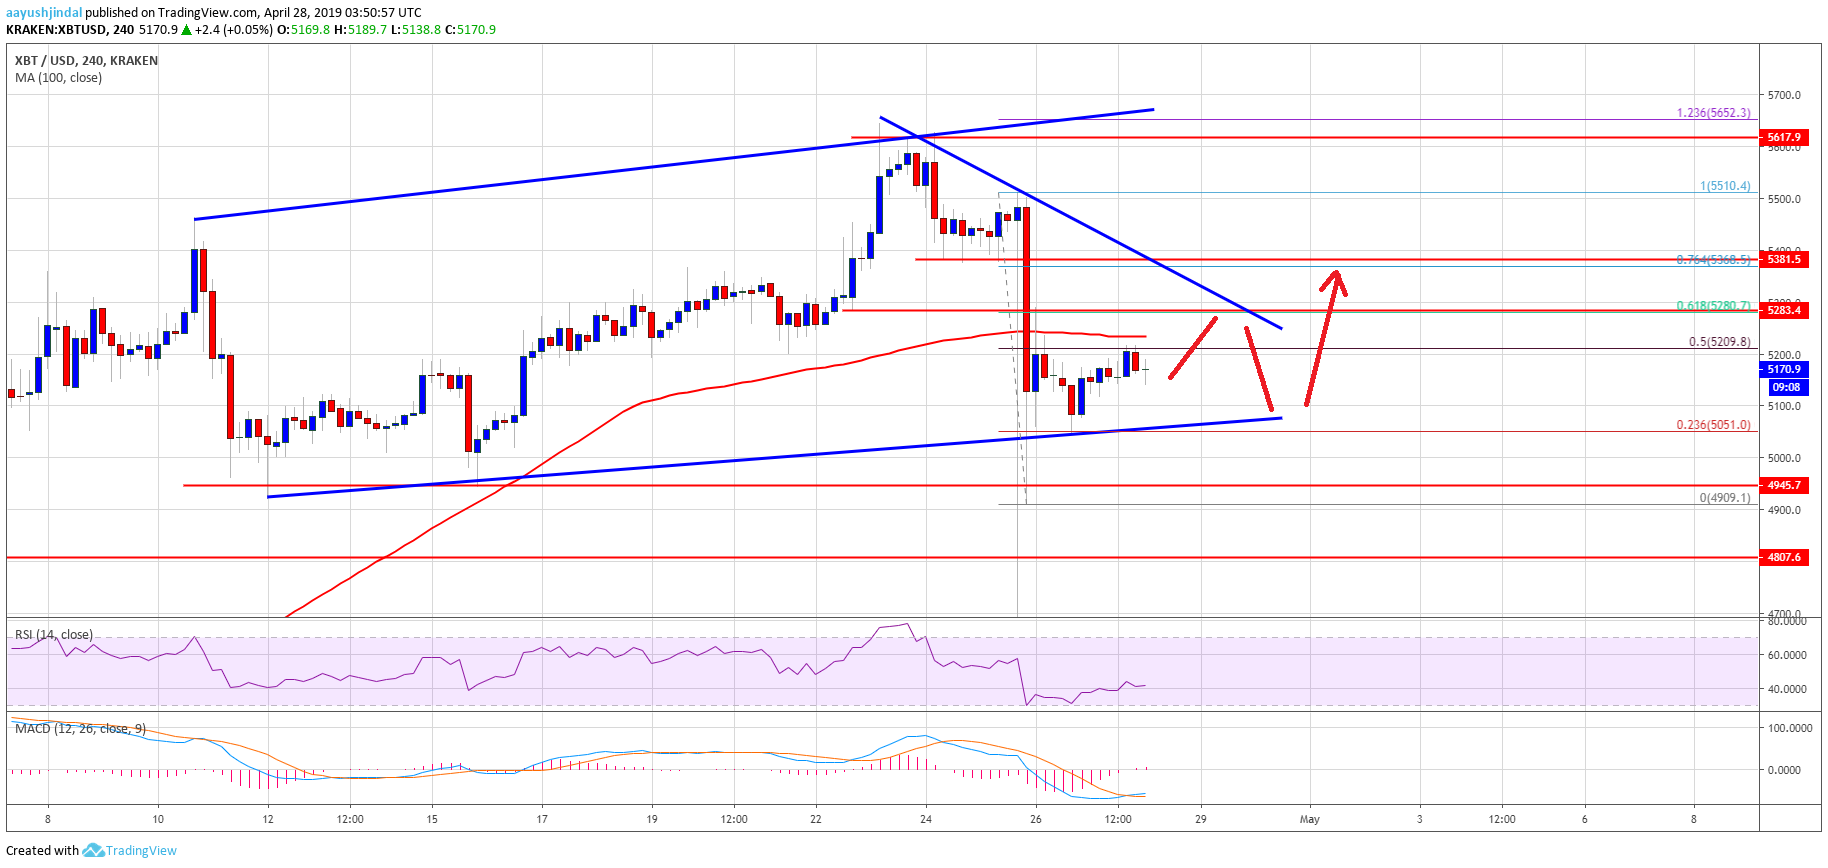
This past week, there was a significant rejection in bitcoin price near the $5,660 level against the US Dollar. The BTC/USD pair started a strong downward move below $5,400 after tether�s drama. The price tumbled below the key $5,280 and $5,200 support levels. There was even a spike below $5,000, plus a close below the 100 simple moving average (4-hours). A swing low was formed near the $4,910 level and recently the price recovered above $5,000 and $5,050.
At the moment, the price is testing the 50% Fib retracement level of the last drop from the $5,510 swing high to $4,910 swing low. However, the $5,220 area and the 100 simple moving average (4-hours) are acting as hurdles. Above $5,220, there is a major resistance near $5,280 and a connecting bearish trend line. The 61.8% Fib retracement level of the last drop from the $5,510 swing high to $4,910 swing low is also near the $5,280 level. A successful close above the $5,280 level might trigger a decent recovery in the near term.
On the downside, there is a major bullish trend line in place with support at $5,080 on the 4-hours chart of the BTC/USD pair. The trend line support near $5,080 is very important, below which the price could test $5,000. If there is a daily close below $5,000, the price is likely to move further into a bearish zone. In the mentioned case, the price will most likely test $4,800 or $4,750.
Bitcoin Price Weekly Analysis (BTC)
Looking at the chart, bitcoin price faced a strong selling interest below $5,400. However, it managed to stay above the $5,000 support. Therefore, there are chances of a recovery above the $5,280 resistance levels. If there is a close above $5,280, there are chances of move towards $5,400 or even $5,500.
Technical indicators
4 hours MACD � The MACD for BTC/USD is slowly moving into the bullish zone.
4 hours RSI (Relative Strength Index) � The RSI for BTC/USD is back above the 40 level, with a few positive signs.
Major Support Level � $5,050
Major Resistance Level � $5,280
Ripple (XRP) Price Remains At Risk Of Further Decline
Ripple price recovered recently above the $0.2900 level and tested $0.2960 against the US dollar.
The price seems to be facing a strong resistance near the $0.2950 and $0.2960 resistance levels.
There is a connecting bearish trend line forming with resistance near $0.2935 on the hourly chart of the XRP/USD pair (data source from Kraken).
The pair could revisit the $0.2810 level as long as it is trading below $0.2960 and $0.3000.
Ripple price is facing a lot of hurdles on the upside against the US Dollar and bitcoin. XRP remains at a risk of more declines unless it climbs back above the $0.3000 resistance area.
Ripple Price Analysis
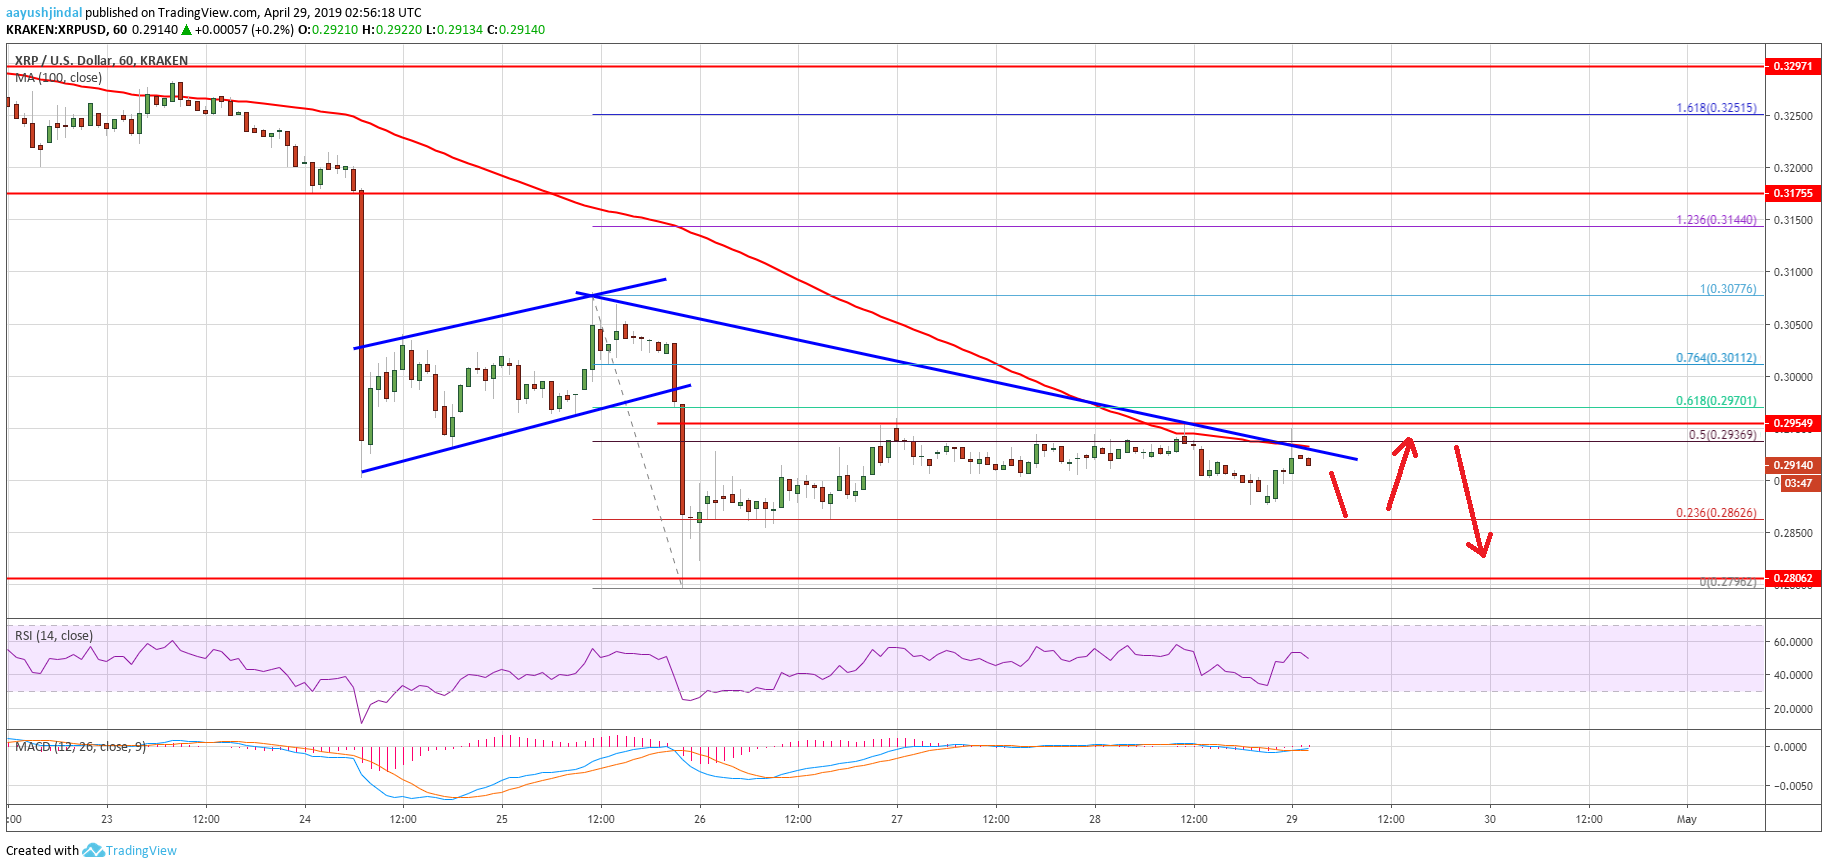
After a short term correction, ripple price extended losses below the $0.2950 support against the US Dollar. The XRP/USD pair broke the $0.2920 support level and declined heavily below $0.2900. It traded close to the $0.2800 level and settled well below the 100 hourly simple moving average. A new monthly low was formed at $0.2796 and the price recently corrected higher. It broke the $0.2860 level and the 23.6% Fib retracement level of the last drop from the $0.3077 high to $0.2796 low.
The price even moved above the $0.2900 level, but it faced a strong resistance near the $0.2950 and $0.2960 resistance levels. More importantly, the price failed to clear the 100 hourly simple moving average, which is currently near $0.2938. Besides, the price failed near the 50% Fib retracement level of the last drop from the $0.3077 high to $0.2796 low. Finally, there is also a connecting bearish trend line forming with resistance near $0.2935 on the hourly chart of the XRP/USD pair.
Therefore, ripple must break the $0.2950 resistance, the trend line, and the 100 hourly SMA. A successful close above the $0.2950-0.2960 zone could push the price towards the next resistance at $0.3000. Once there is a daily close above $0.3000, the price may start a decent recovery in the near term. On the downside, an initial support is near the $0.2860 level. If the bulls struggle to keep the price above $0.2860, the price could revisit the $0.2810 and $0.2800 support levels.
Ripple Price Analysis XRP Chart
Looking at the chart, ripple price is clearly trading in a tight range below key resistances near $0.2960 and $0.3000. The bulls need to gain traction above $0.3000 to push the price back in a positive zone. If not, there is a risk of a fresh decline towards the $0.2810 or $0.2750 level.
Technical Indicators
Hourly MACD � The MACD for XRP/USD is likely to remain in the bearish zone.
Hourly RSI (Relative Strength Index) � The RSI for XRP/USD recently jumped above the 50 level.
Major Support Levels � $0.2860, $0.2810 and $0.2800.
Major Resistance Levels � $0.2950, $0.2960 and $0.3000.
Bitcoin price rebounded above $5,100 after a massive drop towards $4,900 against the US Dollar.
The price seems to be facing a strong resistance near the $5,200 and $5,220 levels.
There is a major bearish trend line in place with resistance near $5,230 on the hourly chart of the BTC/USD pair (data feed from Kraken).
The pair could either rally above the $5,250 resistance or start a fresh decline in the near term.
Bitcoin price is facing a significant resistance against the US Dollar. BTC is likely to climb sharply if it settles above $5,250 and the 100 hourly simple moving average.
Bitcoin Price Analysis
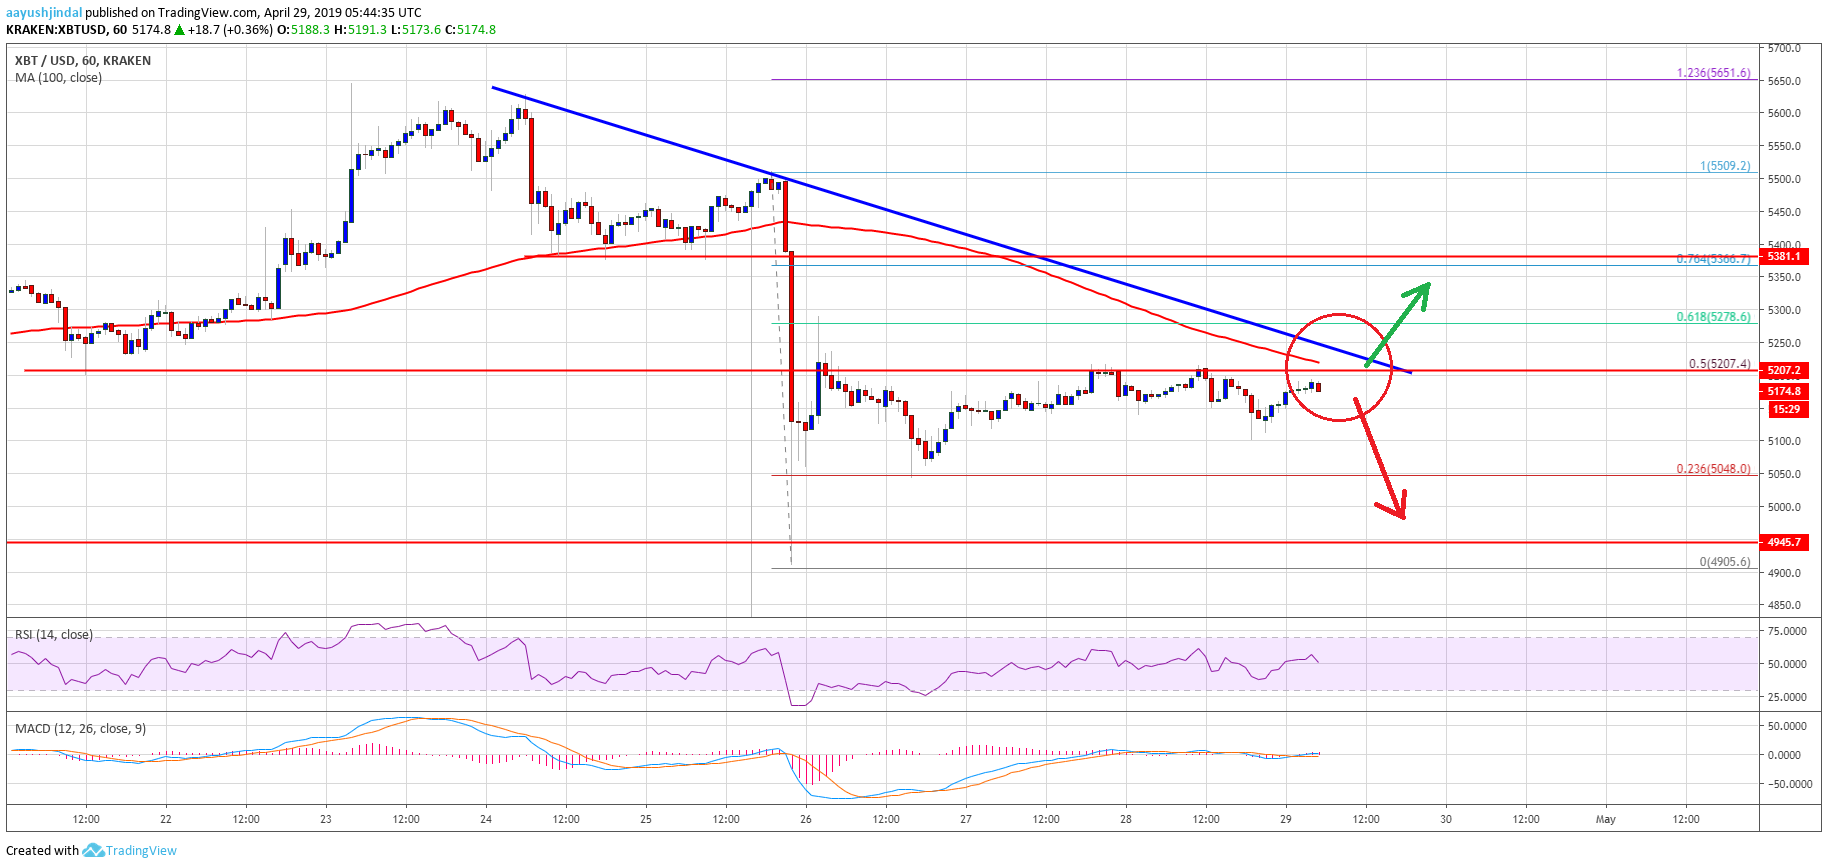
This past week, there was a sharp drop in bitcoin price below the $5,200 support against the US Dollar. The BTC/USD pair even spiked below the $5,000 support level and formed a swing low above $4,900. Later, the price started a slow and steady recovery above the $5,000 and $5,050 resistance levels. The bulls even pushed the price above the $5,100 resistance and the 23.6% Fib retracement level of the last slide from the $5,509 high to $4,905 low.
It opened the doors for more gains above the $5,150 level, but the price struggled to clear the $5,200 and $5,220 resistance levels. It seems like the 50% Fib retracement level of the last slide from the $5,509 high to $4,905 low is acting as a hurdle. Besides, the 100 hourly simple moving average is also acting as a key resistance near $5,220. More importantly, there is a major bearish trend line forming with resistance near $5,230 on the hourly chart of the BTC/USD pair.
Therefore, the price must break the $5,220 resistance, the trend line, and the 100 hourly SMA. A successful close above $5,250 is likely to start a decent upward move towards the $5,300 level. The next major resistance for the bulls is near the $5,380 level. On the other hand, if there is no upside break, the price may decline below $5,150. An initial support is near the $5,100 level, below which the next stop could be $5,050.
Bitcoin Price Analysis BTC Chart
Looking at the chart, bitcoin price is clearly trading near a crucial juncture below $5,220 and $5,250. If the bulls gain control above $5,220 and $5,250, there could be a decent extension towards the $5,380 resistance level. Conversely, a continuous struggle to clear $5,250 is likely to start a fresh decrease towards the $5,100 or $5,050 level in the near term.
Technical indicators:
Hourly MACD – The MACD is slowly moving in the bullish zone, with a few positive signs.
Hourly RSI (Relative Strength Index) – The RSI for BTC/USD managed to move back above the 50 level.
Major Support Levels – $5,150 followed by $5,100.
Major Resistance Levels – $5,200, $5,220 and $5,250.
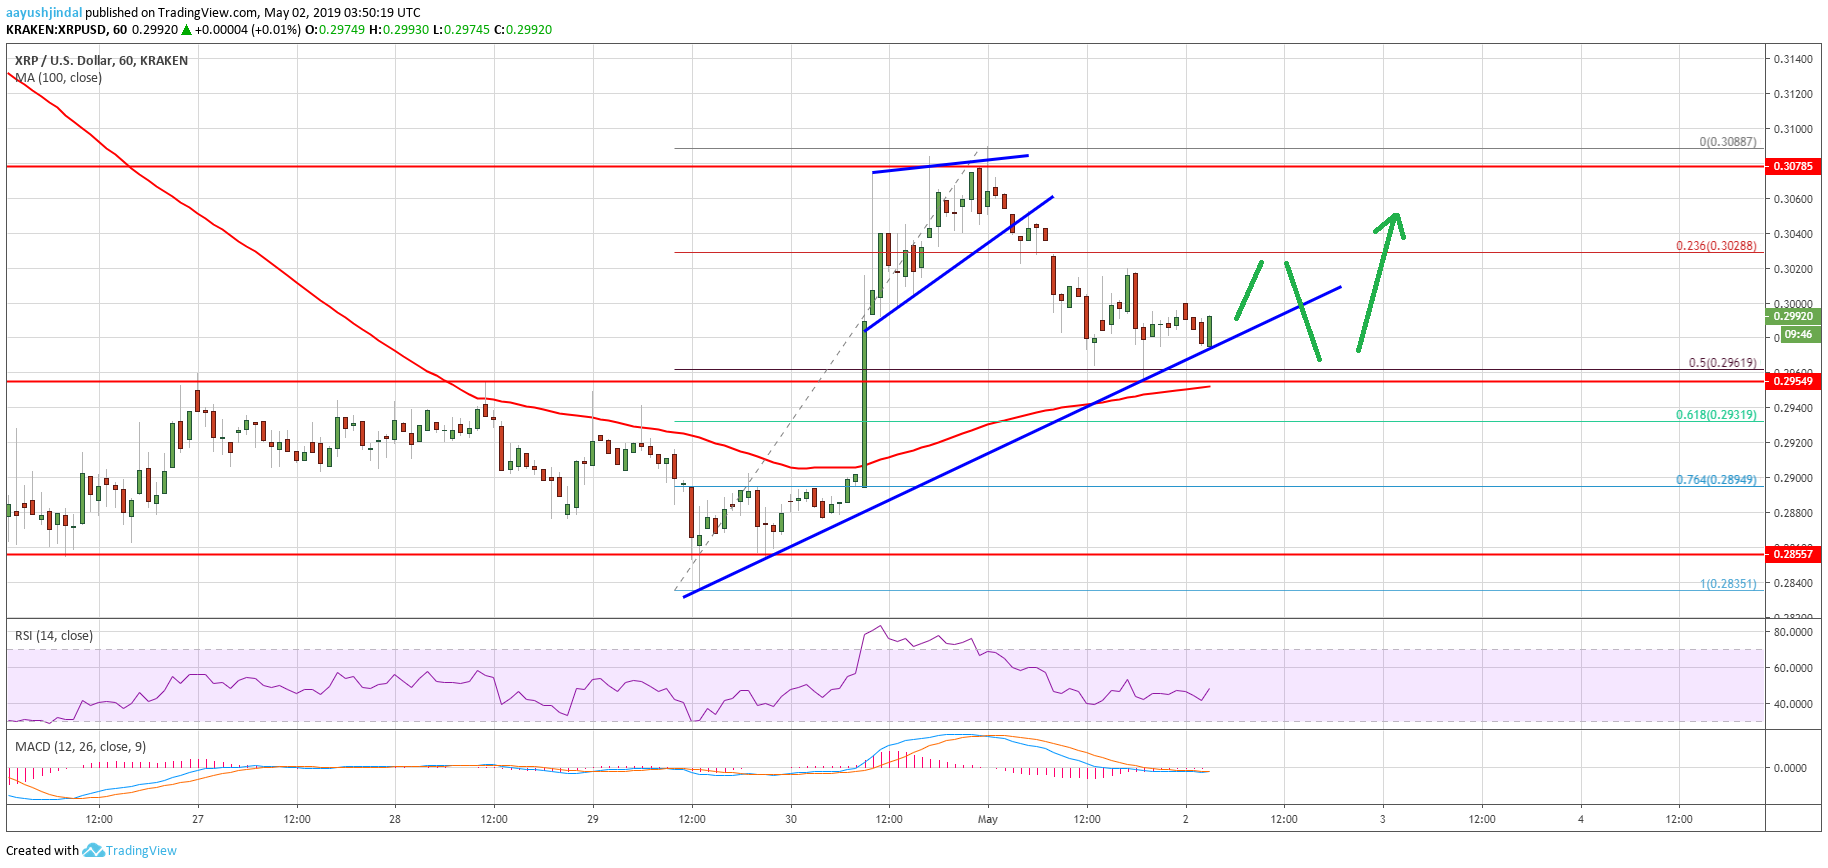
Ripple price traded towards the $0.3080 level and recently corrected lower against the US dollar.
The price traded lower and broke the $0.3040 and $0.3020 support levels.
There is a key bullish trend line in place with support near $0.2965 on the hourly chart of the XRP/USD pair (data source from Kraken).
The pair could dips a few points, but it is likely to bounce back as long as it is above $0.2950
Ripple price is trading with a positive bias above key supports against the US Dollar, but struggling vs bitcoin. XRP could bounce back as long as it is holding the $0.2950 support.
Ripple Price Analysis
Yesterday, we saw a nice upward move in ripple price above the $0.2950 and $0.3000 resistances against the US Dollar. The XRP/USD pair gained traction and broke the $0.3050 level as well and settled above the 100 hourly simple moving average. It traded close to the $0.3090 level and formed a new swing high near $0.3088. Later, it started a downside correction and traded below the $0.3050 support. There was a break below the 23.6% Fib retracement level of the last wave from the $0.2835 low to $0.3088 high.
The price even cleared the $0.3000 support level and tested the main $0.2950 support level. Besides, the 50% Fib retracement level of the last wave from the $0.2835 low to $0.3088 high prevented losses. The price is currently moving higher and trading well above $0.2950. There is also a key bullish trend line in place with support near $0.2965 on the hourly chart of the XRP/USD pair. The pair seems to be well supported near $0.2960 and $0.2950. Besides, the 100 hourly SMA is also positioned near the $0.2950 support area.
On the upside, an initial resistance is near the $0.3000 level, above which the price may test $0.3020. However, a successful close above $0.3050 will most likely set the pace for more gains above the $0.3100 resistance level. The next key resistances are near $0.3120 and $0.3125.
Ripple Price Analysis XRP Chart
Looking at the chart, ripple price is clearing trading above the key $0.2960 and $0.2950 support levels. If there is a downside break below the $0.2950 support and the 100 hourly SMA, the price could move into a bearish zone. An immediate support is near the $0.2910 level, below which the price may revisit the $0.2850 support level in the near term.
Technical Indicators
Hourly MACD � The MACD for XRP/USD is slowly moving in the bearish zone.
Hourly RSI (Relative Strength Index) � The RSI for XRP/USD is currently below the 50 level, but it is holding the 40 level.
Major Support Levels � $0.2960, $0.2950 and $0.2910.
Major Resistance Levels � $0.3020, $0.3050 and $0.3085.
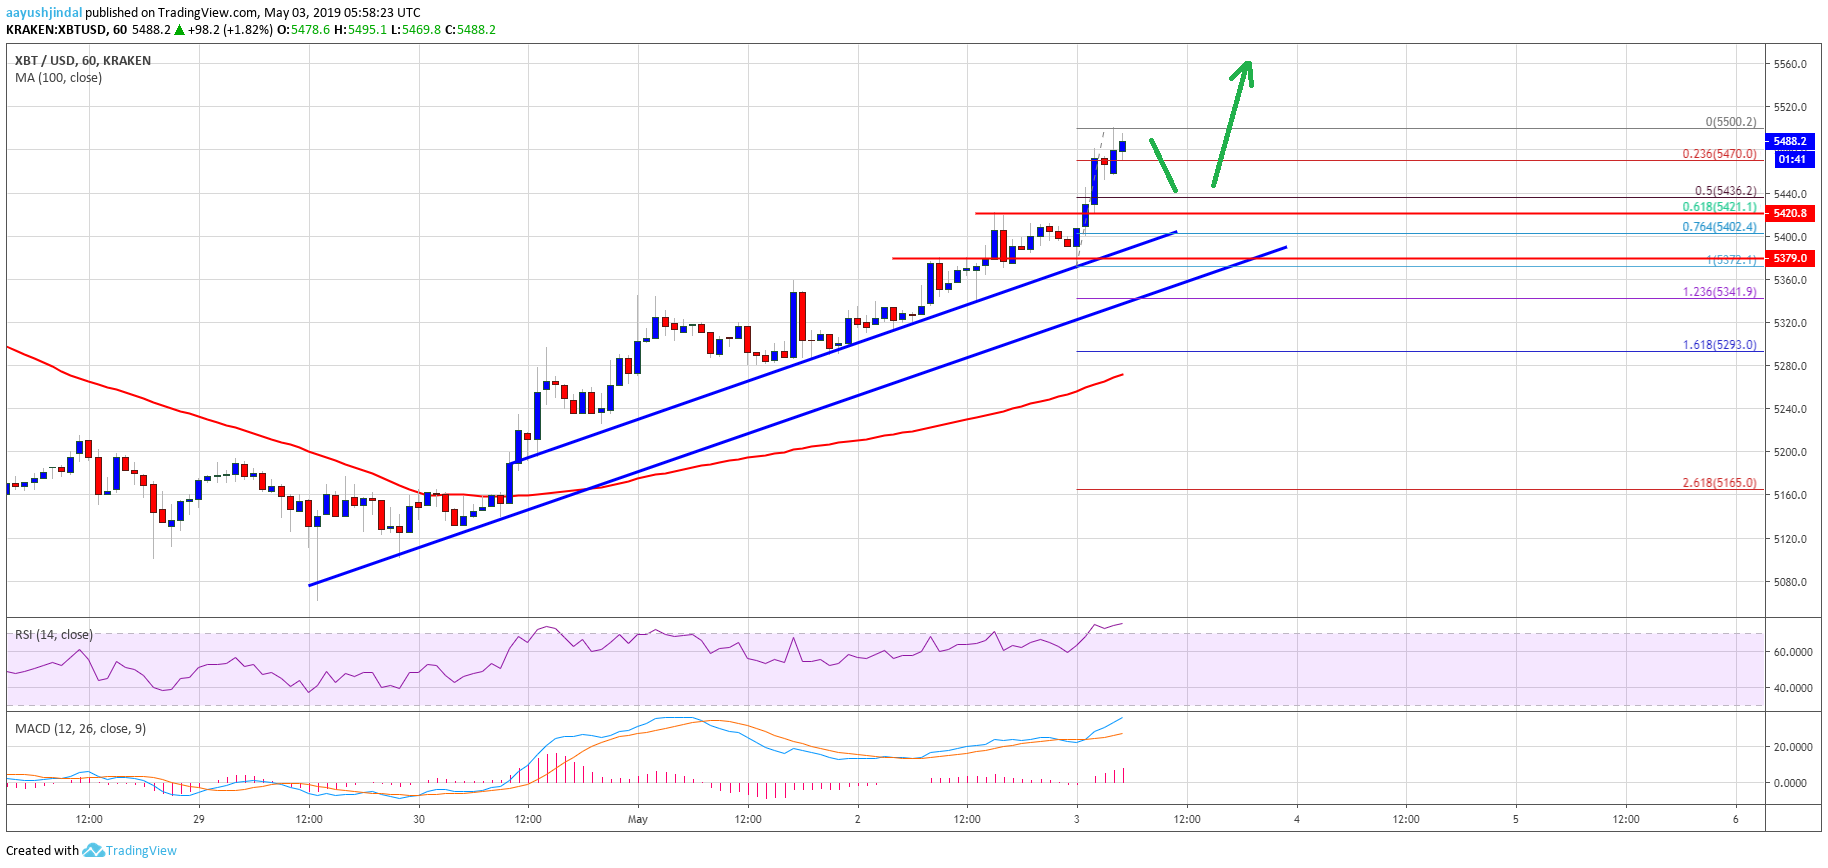
Bitcoin price is following a steady uptrend and recently broke $5,450 against the US Dollar.
The price surged above $5,580 against the USDT and it is currently near $5,500 vs USD on Kraken.
Yesterday�s two bullish trend lines are intact with support near $5,410 and $5,380 on the hourly chart of the BTC/USD pair (data feed from Kraken).
The pair is likely to accelerate gains above the $5,500 and $5,550 levels in the coming sessions.
Bitcoin price is climbing steadily against the US Dollar, while surging versus USDT. BTC is likely to remain in an uptrend towards the $5,600 and $5,650 resistance levels.
Bitcoin Price Analysis
After forming a strong support near $5,120, bitcoin price started a solid uptrend against the US Dollar. The BTC/USD pair broke the $5,300 and $5,380 resistance levels to enter a bullish zone. There was a positive close above the $5,400 level and the 100 hourly simple moving average. The price extended gains above the $5,450 level recently and traded to a new weekly high at $5,500. The current price action is very positive, signaling more gains above $5,550 and $5,600.
An immediate support is at $5,470, and the 23.6% Fib retracement level of the recent move from the $5,372 low to $5,500 high. However, the main support is near the $5,420 level. An intermediate support is at $5,435, and the 50% Fib retracement level of the recent move from the $5,372 low to $5,500 high. Besides, yesterday�s two bullish trend lines are intact with support near $5,410 and $5,380 on the hourly chart of the BTC/USD pair. Therefore, if there is a downside correction, the price is likely to find bids near $5,430 or $5,400.
On the upside, a clear break above the $5,550 and $5,520 levels is likely to push the price towards the $5,600 level. The next key resistance is at $5,640, above which the price may test the $5,700 barrier.
Bitcoin Price Analysis BTC Chart
Looking at the chart, bitcoin price is clearly trading in a strong uptrend above $5,400. Looking at the USDT pairs, BTC traded towards $5,600 on binance, and above $5,800 on bitfinex. The overall price action is very bullish and it seems like there could be more gains above $5,500 versus USD. In the short term, there could be a downside correction, but dips remain well supported near the $5,400 pivot level. Only a close below $5,280 and the 100 SMA might negate the current bullish view.
Technical indicators:
Hourly MACD � The MACD is gaining strong momentum in the bullish zone.
Hourly RSI (Relative Strength Index) � The RSI for BTC/USD is now in the overbought zone.
Major Support Levels � $5,420 followed by $5,400.
Major Resistance Levels � $5,520, $5,550 and $5,600.
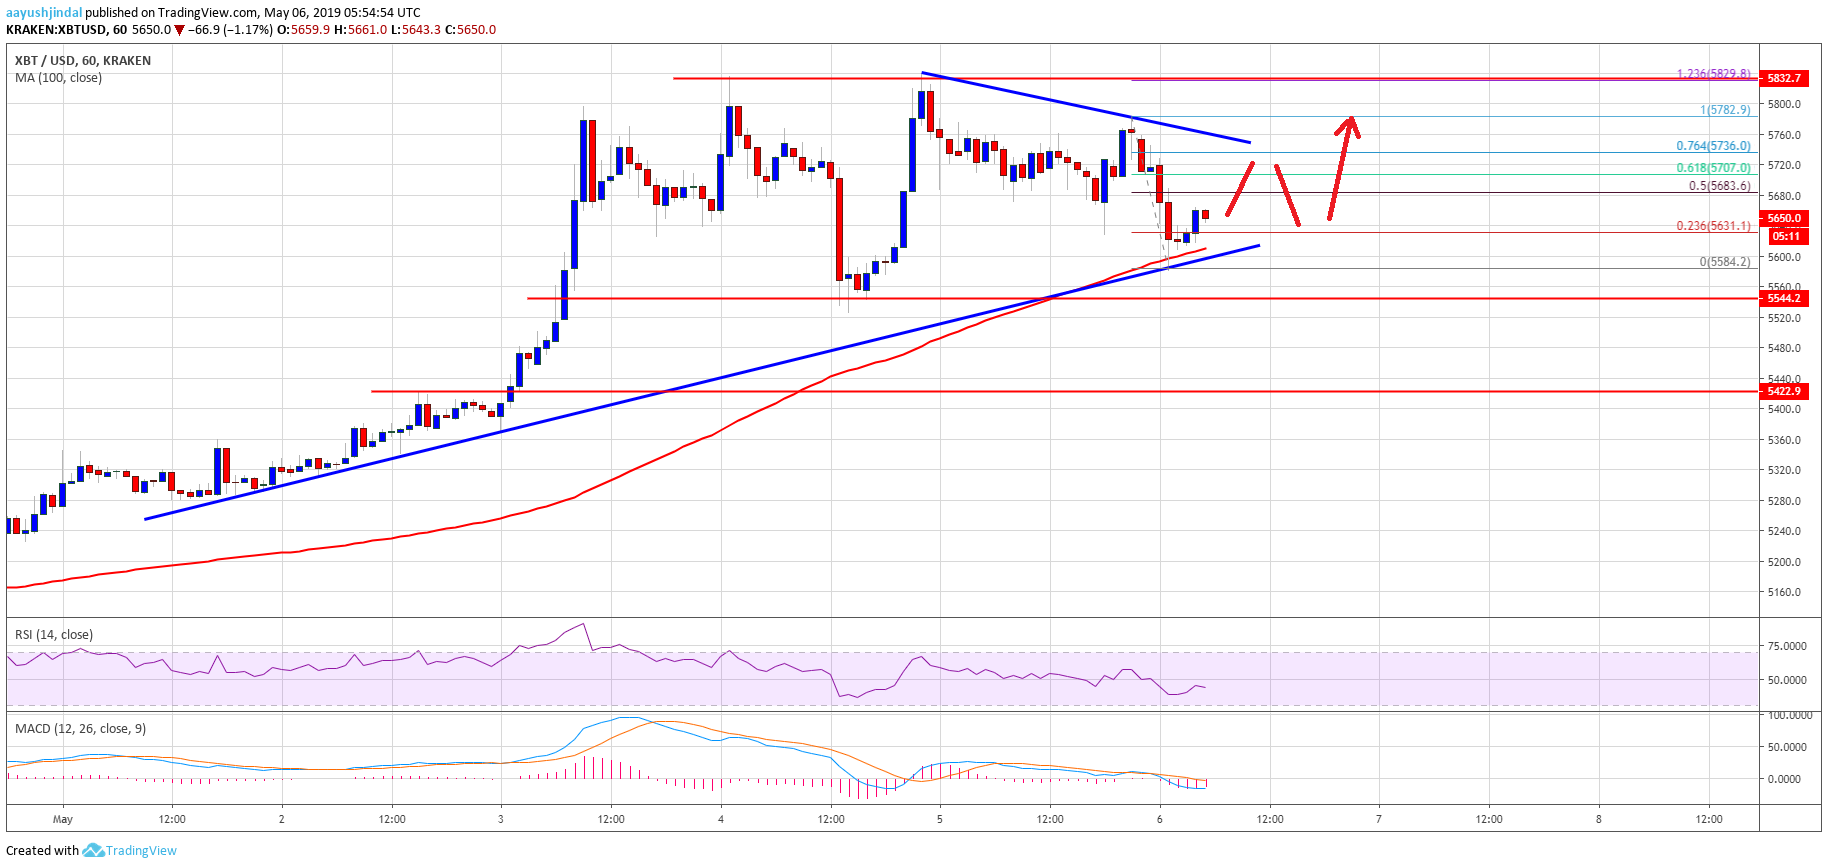
Bitcoin price corrected lower recently after trading above the $5,800 level against the US Dollar.
The price declined below the $5,700 level and tested an important support near $5,580.
There is a key bullish trend line forming with support near $5,600 on the hourly chart of the BTC/USD pair (data feed from Kraken).
The pair is likely to bounce back above $5,700 as long as it is above $5,600 and $5,540.
Bitcoin price remains well supported on the downside above $5,500 against the US Dollar. BTC could start a fresh rise if it clears the $5,700 and $5,780 resistance levels.
Bitcoin Price Analysis
This past week, we saw a strong rise in bitcoin price above the $5,700 resistance against the US Dollar. The BTC/USD pair even broke the $5,800 level and settled well above the 100 hourly simple moving average. The price traded to a new 2019 at $5,837 and recently started a downside correction. It traded below the $5,700 support and the $5,650 pivot level. However, the price remained well bid above the $5,540 and $5,580 support levels.
More importantly, the price is holding the 100 hourly simple moving average and is currently above $5,600. There is also a key bullish trend line forming with support near $5,600 on the hourly chart of the BTC/USD pair. An immediate resistance is near $5,685, and the 50% Fib retracement level of the recent decline from the $5,782 high to $5,584 low. However, the main resistance is near the $5,760 level and a connecting bearish trend line on the same chart. A successful close above $5,760 and $5,780 might push the price above the $5,800 and $5,850 levels.
On the downside, the main support is near the $5,600 level and the 100 hourly SMA. Below $5,600, the next key support is near the $5,540 level, where the bulls may emerge. If there is a downside break below $5,540, the price may revisit the last line of defense near $5,420. Any further losses may push the price in a short term bearish zone towards $5,200 or $5,100.
Bitcoin Price Analysis BTC Chart
Looking at the chart, bitcoin price is currently trading above important support near $5,600 and $5,580. Therefore, there are high chances of a fresh rise above $5,700 and $5,760. If the bulls regain momentum, the price could even trade to a new 2019 high above the $5,850 level in the coming sessions.
Technical indicators:
Hourly MACD � The MACD is currently placed in the bearish zone, with a few negative signs.
Hourly RSI (Relative Strength Index) � The RSI for BTC/USD is currently recovering, but it is still well below the 50 level.
Major Support Levels � $5,600 followed by $5,540.
Major Resistance Levels � $5,680, $5,700 and $5,760.
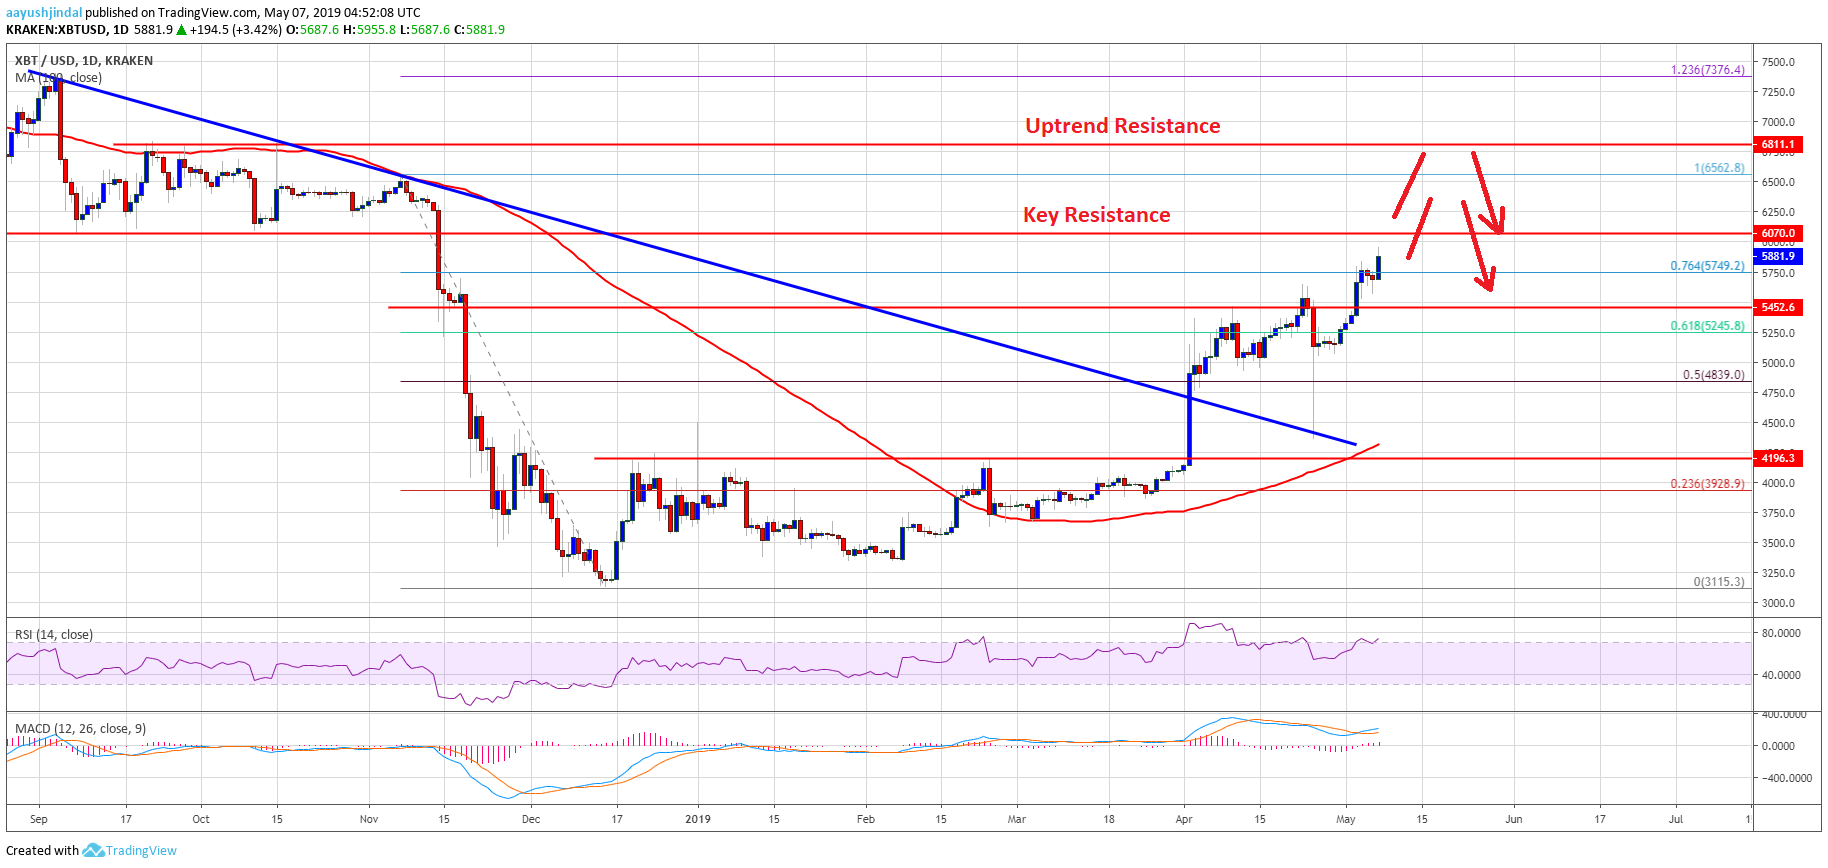
Bitcoin price rallied another 4% and climbed above $5,850 against the US Dollar.
The price is surging higher, but there are many hurdles near $6,000, $6,070 and $6,100.
There was a break above a crucial bearish trend line at $4,730 on the daily chart of the BTC/USD pair (data feed from Kraken).
The pair could spike above $6,000 or even towards $6,800 before correcting lower sharply.
Bitcoin price is surging higher towards $6,000 against the US Dollar. BTC could extend gains, but it is facing two important hurdles near $6,100 and $6,800 on the daily chart.
Bitcoin Price Analysis
In the past few days, there was a steady rise in bitcoin price from the $4,000 swing low against the US Dollar. The BTC/USD pair broke the $4,400 and $4,700 resistance levels to start a strong upward move. There was even a close above the $4,200 resistance and the 100-day simple moving average. The bulls pushed the price above the 50% Fib retracement level of the last major decline from the $6,562 high to $3,115 low.
More importantly, there was a break above a crucial bearish trend line at $4,730 on the daily chart of the BTC/USD pair. Recently, the pair broke the $5,250 and $5,500 resistance levels to extend gains. It is now trading well above the 76.4% Fib retracement level of the last major decline from the $6,562 high to $3,115 low. These all are positive signs, suggesting more gains above the $5,900 level. However, there are many hurdles on the upside near the $6,000, $6,070 and $6,100 levels. The $6,070 level was the previous breakdown support and it may now prevent gains.
If there is an upside break above $6,100, there could be an upside extension towards the $6,532 swing high. The main resistance above $6,500 is near the $6,800 level, the main pivot zone of Oct 2018. Therefore, there are chances of a strong bearish reaction from $6,100, $6,500 or $6,800 in the coming days.
Bitcoin Price Analysis BTC Chart
Looking at the chart, bitcoin price seems to be gaining pace above the $5,500 and $5,600 levels. Having said that, the bulls are likely to face a strong offer zone near $6,000, $6,070 and $6,100. If there is a successful close above $6,100, the price may climb higher towards $6,500 or even $6,800 before starting a substantial downside correction. On the downside, there are many supports near $5,540, $5,450 and $5,250. Below these, the price may revisit $5,000.
Technical indicators:
Daily MACD � The MACD is gaining bullish momentum with many positive signs.
Daily RSI (Relative Strength Index) � The RSI for BTC/USD climbed above the 70 level and it seems to be heading towards the 80 level.
Monthly Support Levels � $5,450 followed by $5,250.
Monthly Resistance Levels � $6,070, $6,500 and $6,800.
Bitcoin (BTC) Price Defies Gravity With Upsurge, Bulls Aiming $6.5K
Bitcoin price was unfazed and it recently broke the $6,200 resistance level against the US Dollar.
The price even broke the $6,300 level and it seems like the bulls are now aiming $6,500.
There is a major bullish trend line forming with support at $6,050 on the hourly chart of the BTC/USD pair (data feed from Kraken).
The pair could find a strong buying interest if it corrects lower towards $6,100 or $6,000.
Bitcoin price rallied more than 4% and cleared $6,300 against the US Dollar. BTC remains in a strong uptrend and it seems like the bulls are now aiming a test of $6,400 or even $6,500.
Bitcoin Price Analysis
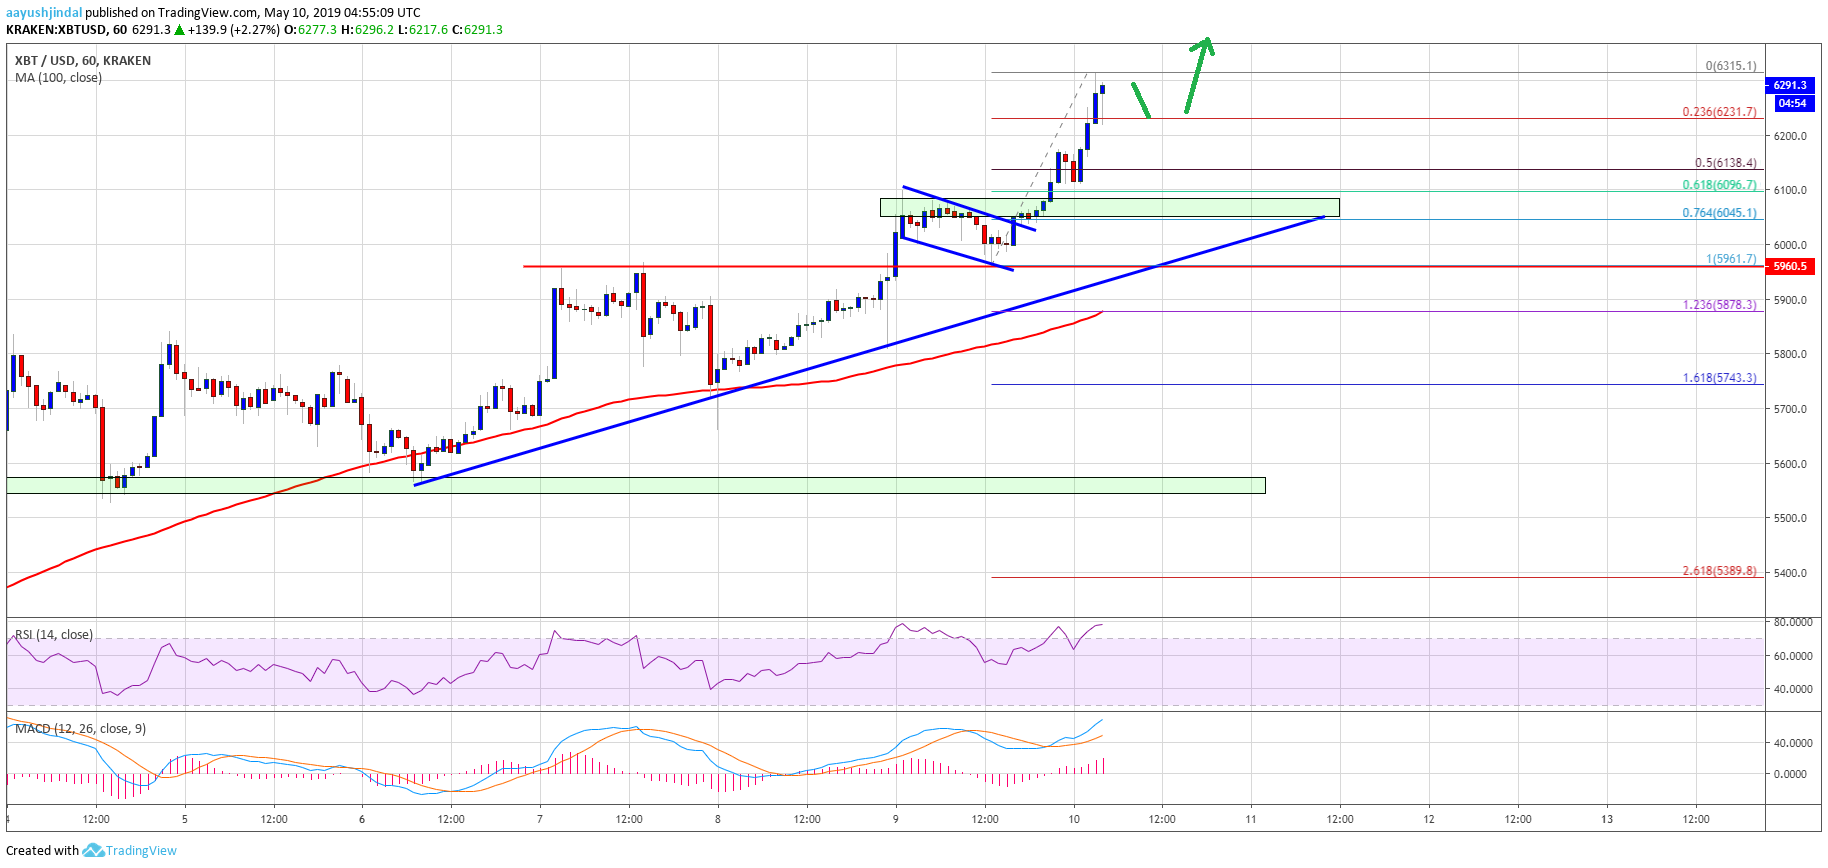
This week, bitcoin price overcame all hurdles and rallied above $6,000 and $6,200 against the US Dollar. The BTC/USD pair gained bullish momentum after it settled above $6,100 and the 100 hourly simple moving average. Recently, it broke a bullish flag pattern with resistance near $6,040 on the hourly chart to start a strong upward move. As a result, the bulls pushed the price above the $6,250 and $6,300 resistance levels. A new 2019 high was formed at $6,315 and the price is likely to extend gains.
An initial support is near the $6,230 level, and the 23.6% Fib retracement level of the recent rally from the $5,961 low to $6,315 high. If there is a downside extension, the next key support could be $6,140. It represents the 50% Fib retracement level of the recent rally from the $5,961 low to $6,315 high. More importantly, there is a major bullish trend line forming with support at $6,050 on the hourly chart of the BTC/USD pair. Moreover, the previous resistance area near $6,050 is likely to act as a strong buy zone if the price corrects lower.
Besides, the price is now well above the $6,000 pivot level and the bullish 100 hourly SMA. Therefore, there are chances of more upsides above the $6,300 and $6,350 levels. The next main hurdle is near the $6,400 level, above which the price could rally towards the $6,500 level.
Bitcoin Price Analysis BTC Chart
Looking at the chart, bitcoin price is gaining bullish momentum above $6,200 and $6,300, with no major bearish sign. In the short term, there could be a few bearish moves, but dips remain supported near the $6,200 and $6,100 levels. Only a daily close below $6,000 and the 100 hourly SMA could start a substantial downside correction.
Technical indicators:
Hourly MACD � The MACD is currently placed heavily in the bullish zone, with positive signs.
Hourly RSI (Relative Strength Index) � The RSI for BTC/USD is currently correcting lower in the overbought zone.
Major Support Levels � $6,200 followed by $6,140.
Major Resistance Levels � $6,300, $6,400 and $6,500.
Bitcoin price surged more than 10% and broke the key $8,000 barrier against the US Dollar.
The price traded to a new 2019 high close to $8,180 and remains in a strong uptrend.
There is a short term bullish pattern forming with resistance near $8,050 on the hourly chart of the BTC/USD pair (data feed from Kraken).
The pair could rally further towards $8,500 once it breaks $8,050 and $8,100.
Bitcoin price rallied significantly and broke $8,000 against the US Dollar. BTC bulls remain in full control and they are likely to target the $8,500 level in the coming sessions.
Bitcoin Price Analysis
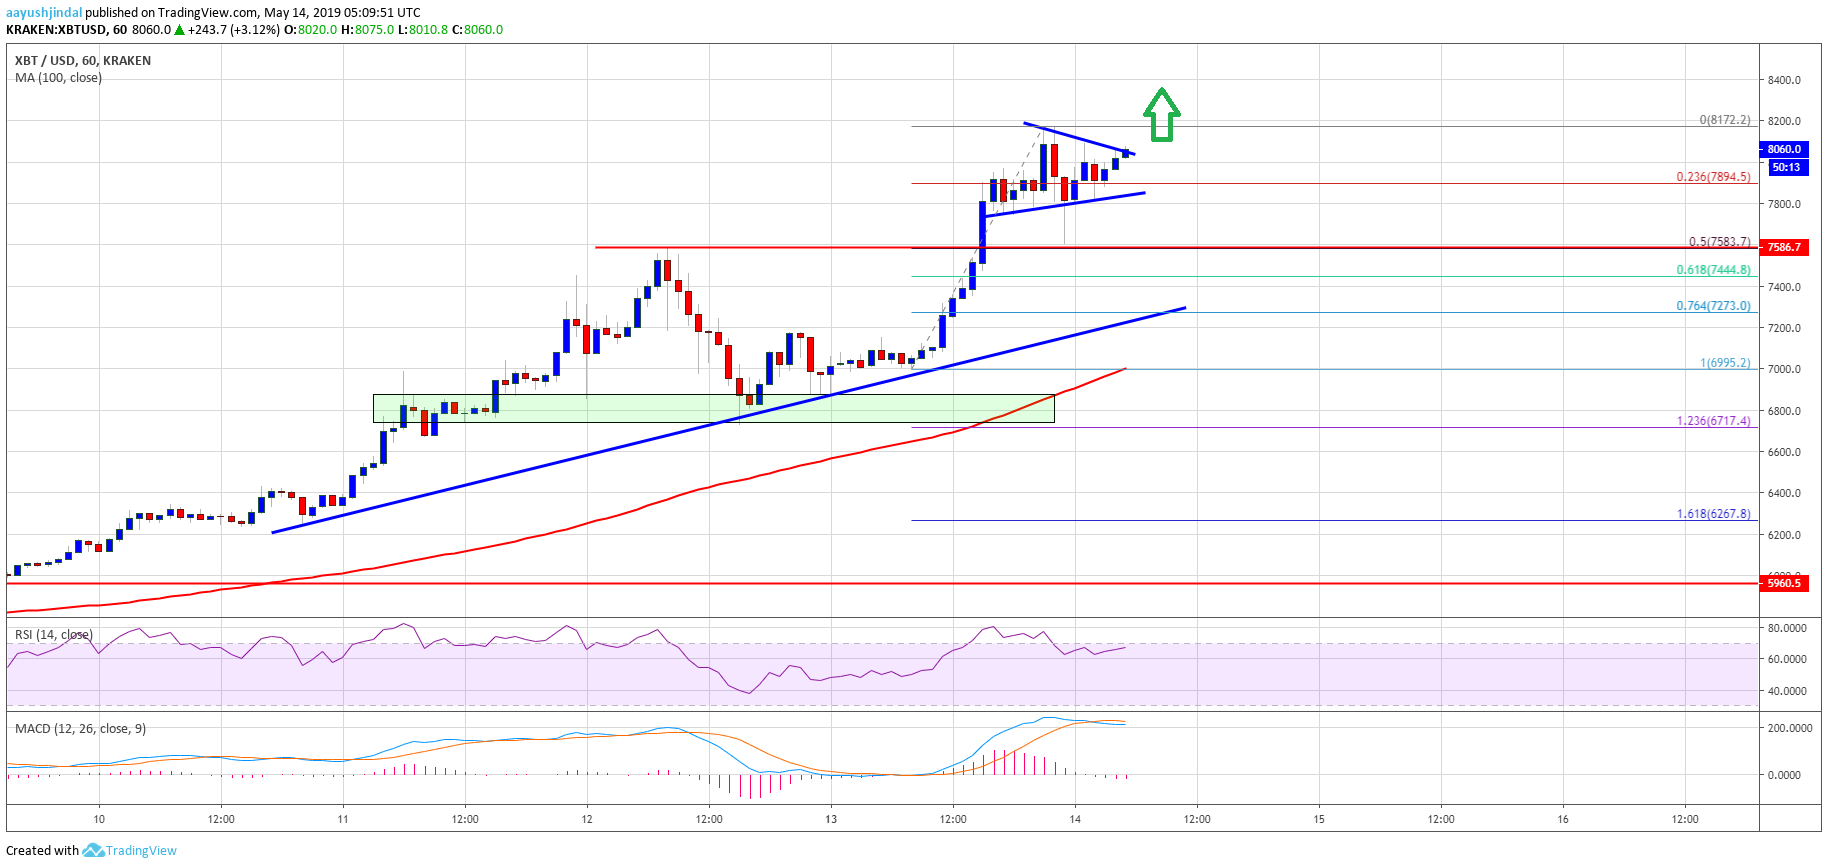
There was no stopping bitcoin after it broke the $7,500 resistance level against the US Dollar. The BTC/USD pair started a fresh rally after forming a swing low at $6,995. It broke the $7,200 and $7,500 resistance levels, plus remained well above the 100 hourly simple moving average. Finally, the bulls were able to clear the last swing high near $7,580 and pushed the price towards the $8,000 barrier. There was a clear break above the $8,000 barrier and the price posted a new 2019 high close to $8,180.
Recently, there was a sharp downside correction below $7,850 and the 23.6% Fib retracement level of the upward move from $6,995 low to $8,172 high. The price even dipped below the $7,800 level. However, the $7,600 level acted as a strong support. Besides, the 50% Fib retracement level of the upward move from $6,995 low to $8,172 high acted as a support. The price is now back above $7,800 and $7,950. Moreover, there is a short term bullish pattern forming with resistance near $8,050 on the hourly chart of the BTC/USD pair.
The pair seems to be ready to clear the triangle resistance at $8,050 and trade towards the $8,172 swing high. Additionally, there are high chances of a break above the $8,200 and $8,320 resistance levels. The next stop for the bulls could be $8,500.
Bitcoin Price Analysis BTC Chart
Looking at the chart, bitcoin price is likely setting up for more gains above the $8,050 and $8,150 levels. Conversely, if there is a downside correction, the price may find buyers near the $7,950 and $7,840 levels. The main support for the current wave is near $7,580 (the recent breakout level). The overall price action is super bullish, with technical indicators pointing a run towards $8,500 or even $9,000.
Technical indicators:
Hourly MACD � The MACD is sighting a fresh increase in the bullish zone.
Hourly RSI (Relative Strength Index) � The RSI for BTC/USD is currently well above the 55 and 60 levels.
Major Support Levels � $7,950 followed by $7,840
Major Resistance Levels � $8,050, $8,170 and $8,320