NexusFi: Find Your Edge


Home Menu


The CL Crude-analysis Thread


Discussion in Commodities

Updated
      Top Posters
    1. looks_one SMCJB with 683 posts (1,274 thanks)
    2. looks_two mfbreakout with 303 posts (479 thanks)
    3. looks_3 WilleeMac with 275 posts (218 thanks)
    4. looks_4 ron99 with 165 posts (262 thanks)
      Best Posters
    1. looks_one SMCJB with 1.9 thanks per post
    2. looks_two mfbreakout with 1.6 thanks per post
    3. looks_3 ron99 with 1.6 thanks per post
    4. looks_4 WilleeMac with 0.8 thanks per post
    1. trending_up 618,001 views
    2. thumb_up 3,558 thanks given
    3. group 286 followers
    1. forum 2,696 posts
    2. attach_file 644 attachments


Search this Thread

The CL Crude-analysis Thread

  #2081 (permalink)
 jokertrader 
NYC, NY
 
Experience: Intermediate
Platform: Sierra, TT
Broker: N/A
Trading: Spread Researcher and crypto degen
Posts: 654 since May 2013
Thanks Given: 545
Thanks Received: 360

Now that it is getting to the holiday time, thought i would take 1 more crack at getting the CL spread analysis right.

There are some limitations to downloading data quickly and its a little labor intensive but once i know what i am trying to achieve I can explore automation.

Lets say we want to analyse the near term 6 month spreads - M18/Z18 and Z18/M19 but i will use M18/Z18 for this discussion

Contract: M18/Z18 (CLES6M8 in CQG)

First question I would have is
A) Whether calendar spreads can be mean reverting (like flys) or generally follow the Cl curve or say the 1M spread curve
The answer to that would probably dictate what further analysis is essential
- Should I also compare it with the CL outright curve for 2018?
- Should I compare it to the 1M spreads for 2018?

If mean reverting, would I not compare the 6m spread to the fly curve (M18/U18/Z18 or something else?)


b) Historic Analysis: Assuming we will need to compare it to the same spread for previous years so M17/Z17, M16/Z16 etc

Second Question: I am sure we can superimpose and compare visually but there is probably more value in running statistical regression analysis between the curves
- Am i using polynomial regression or liner is fine?
- Am i comparing the CLES6M8 with not only the same historic spreads but also the outright or 1M spreads?

- I would think there would be need to compare the effect on historic correlation between CL outright and the 6 month spread and extrapolate the value to the current relationship between CL and 6month spreads
(for example in 2016, look at CL curve and the 6month spread in 2016 and use that for 2018?)


Data Gathering:
I can get current and future spreads using CQG RTD but limited to 300 rows (MS RTD limitation).
Also I am not be able to get historic data on the spreads. So I am limited to

- Use CQG RTD to output spread for current/future spreads
- Use download for Sierra historic charts for individual contracts, dump into excel and diff M vs Z (since cannot get historic spread charts but can get 10 year data for outrights)
Third Question: I am assuming i can do the Last price for M vs Last price for Z to come up with the daily spread settlement price

So currently have CLES6M8 (6 month spread M/Z for 2018) and the same 6 month contracts for 16 and 17


Notes:
- My goal is to move away from M/Z to Z18/M19 when it gets close to 50 days to expire of M18
- Conducted calendar and fly analysis for future months and find M, Z are the best months (this was discussed previously.. though H and U are also viable but M/Z are better)
- For exchange flys, i see implied being turned on but volume seems low for 6 and 12 months but very good volume for 2018 1M flys

Ok enough rambling for now.. more later.. once i get some better answers and run some analysis
Thanks to all who could guide me and i am more willing to share with any newbies (we can be the blind leading the blind)

Visit my NexusFi Trade Journal Reply With Quote
Thanked by:

Can you help answer these questions
from other members on NexusFi?
Better Renko Gaps
The Elite Circle
NT7 Indicator Script Troubleshooting - Camarilla Pivots
NinjaTrader
REcommedations for programming help
Sierra Chart
About a successful futures trader who didnt know anythin …
Psychology and Money Management
What broker to use for trading palladium futures
Commodities
 
  #2082 (permalink)
 jokertrader 
NYC, NY
 
Experience: Intermediate
Platform: Sierra, TT
Broker: N/A
Trading: Spread Researcher and crypto degen
Posts: 654 since May 2013
Thanks Given: 545
Thanks Received: 360

Maybe I will ask a simple question first. If I have an exchange traded spread and open an outright which is an opposite of one of the legs of the calendar spread what happens to the exchange spread? Example I buy CL M18/z18 I.e long M and short Z then I just sell a M18 CL outright separately what happens??


Sent using the NexusFi mobile app

Visit my NexusFi Trade Journal Reply With Quote
  #2083 (permalink)
 
SMCJB's Avatar
 SMCJB 
Houston TX
Legendary Market Wizard
 
Experience: Advanced
Platform: TT and Stellar
Broker: Advantage Futures
Trading: Primarily Energy but also a little Equities, Fixed Income, Metals and Crypto.
Frequency: Many times daily
Duration: Never
Posts: 5,049 since Dec 2013
Thanks Given: 4,388
Thanks Received: 10,207


An exchange traded spread isn't a contract in itself, it's a spread between two contracts. If you execute an exchange traded spread what hit's your account are the outright futures involved in the spread.

Answering your question - you would be short Z18

Reply With Quote
Thanked by:
  #2084 (permalink)
 
SMCJB's Avatar
 SMCJB 
Houston TX
Legendary Market Wizard
 
Experience: Advanced
Platform: TT and Stellar
Broker: Advantage Futures
Trading: Primarily Energy but also a little Equities, Fixed Income, Metals and Crypto.
Frequency: Many times daily
Duration: Never
Posts: 5,049 since Dec 2013
Thanks Given: 4,388
Thanks Received: 10,207

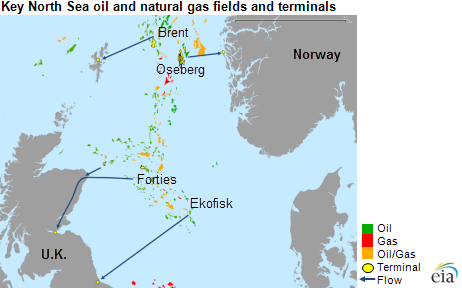
The Brent Price/Index doesn't just represent Brent Crude anymore, it's now a North Sea Basket Index, "BFOE" made up of Brent, Forties, Oseberg & Ekofisk. Today the pipeline that brings Forties onshore was shut down for an estimated 2 weeks.

UK pipeline outage sends oil price to more than two-year high
https://www.reuters.com/article/us-oil-forties/uk-pipeline-outage-sends-oil-price-to-more-than-two-year-high-idUSKBN1E6115


Reply With Quote
Thanked by:
  #2085 (permalink)
 icog 
Sofia Bulgaria
 
Experience: Intermediate
Platform: TradeStation
Broker: TradeStation
Trading: Everything
Posts: 194 since Oct 2016
Thanks Given: 391
Thanks Received: 181

Now its getting interesting. After SO many bullish news this week, plus bullish invetory data, CL is going down? I can only imagine what will happen when these longs i saw in the last COT report try to exit the market. Together. Quickly. The optimistic target will be 52.80, which is 50% retracement of the last leg up. Popcorn time for me, good luck trading that "OMG" market action.

Reply With Quote
Thanked by:
  #2086 (permalink)
 
SMCJB's Avatar
 SMCJB 
Houston TX
Legendary Market Wizard
 
Experience: Advanced
Platform: TT and Stellar
Broker: Advantage Futures
Trading: Primarily Energy but also a little Equities, Fixed Income, Metals and Crypto.
Frequency: Many times daily
Duration: Never
Posts: 5,049 since Dec 2013
Thanks Given: 4,388
Thanks Received: 10,207

Morningstar Research :- Permian Makes and the World Takes?

Quoting 
Window on the World
It’s been a good year for U.S. crude, reflected in both production and export levels. Output increased by over a million barrels/day, or mmb/d, during 2017 through Dec. 8, according to weekly Energy Information Administration data. Most of that growth came from shale basins—particularly the prolific Permian—as well as conventional plays such as the offshore Gulf of Mexico. This incremental production is largely unwanted by domestic refiners, which are already processing all the light shale crude they can handle. As a result, new production is being exported to fill demand gaps left by OPEC organized production cuts and increased worldwide economic activity. Crude exports have averaged 945 mb/d this year through Dec. 8, according to EIA weekly data, nearly matching incremental domestic output. With worldwide demand pulling new production overseas, U.S. crude analysis now requires an outward-facing window on the world. That places greater importance on international fundamental factors, such as last week’s major North Sea pipeline shutdown. This note looks at the impact on U.S. crude markets of a growing export focus.

https://www.morningstar.com/products/commodities-and-energy/Research/permian-makes-and-the-world-takes-FINAL.pdf

Reply With Quote
  #2087 (permalink)
atomoxod
Moscow
 
Posts: 1 since Dec 2017
Thanks Given: 0
Thanks Received: 0


jokertrader View Post
Now that it is getting to the holiday time, thought i would take 1 more crack at getting the CL spread analysis right.

There are some limitations to downloading data quickly and its a little labor intensive but once i know what i am trying to achieve I can explore automation.

Lets say we want to analyse the near term 6 month spreads - M18/Z18 and Z18/M19 but i will use M18/Z18 for this discussion

Contract: M18/Z18 (CLES6M8 in CQG)

First question I would have is
A) Whether calendar spreads can be mean reverting (like flys) or generally follow the Cl curve or say the 1M spread curve
The answer to that would probably dictate what further analysis is essential
- Should I also compare it with the CL outright curve for 2018?
- Should I compare it to the 1M spreads for 2018?

If mean reverting, would I not compare the 6m spread to the fly curve (M18/U18/Z18 or something else?)


b) Historic Analysis: Assuming we will need to compare it to the same spread for previous years so M17/Z17, M16/Z16 etc

Second Question: I am sure we can superimpose and compare visually but there is probably more value in running statistical regression analysis between the curves
- Am i using polynomial regression or liner is fine?
- Am i comparing the CLES6M8 with not only the same historic spreads but also the outright or 1M spreads?

- I would think there would be need to compare the effect on historic correlation between CL outright and the 6 month spread and extrapolate the value to the current relationship between CL and 6month spreads
(for example in 2016, look at CL curve and the 6month spread in 2016 and use that for 2018?)


Data Gathering:
I can get current and future spreads using CQG RTD but limited to 300 rows (MS RTD limitation).
Also I am not be able to get historic data on the spreads. So I am limited to

- Use CQG RTD to output spread for current/future spreads
- Use download for Sierra historic charts for individual contracts, dump into excel and diff M vs Z (since cannot get historic spread charts but can get 10 year data for outrights)
Third Question: I am assuming i can do the Last price for M vs Last price for Z to come up with the daily spread settlement price

So currently have CLES6M8 (6 month spread M/Z for 2018) and the same 6 month contracts for 16 and 17


Notes:
- My goal is to move away from M/Z to Z18/M19 when it gets close to 50 days to expire of M18
- Conducted calendar and fly analysis for future months and find M, Z are the best months (this was discussed previously.. though H and U are also viable but M/Z are better)
- For exchange flys, i see implied being turned on but volume seems low for 6 and 12 months but very good volume for 2018 1M flys

Ok enough rambling for now.. more later.. once i get some better answers and run some analysis
Thanks to all who could guide me and i am more willing to share with any newbies (we can be the blind leading the blind)

Hi!

I can help you with a building futures spread problem.
I develop a tool for it.

Reply With Quote
  #2088 (permalink)
 
CobblersAwls's Avatar
 CobblersAwls 
London, United Kingdom
 
Experience: Intermediate
Platform: N/A
Broker: Bloomberg
Trading: Energies
Posts: 310 since Jul 2014
Thanks Given: 1,089
Thanks Received: 386

Key Notes:

The Shanghai International Energy Exchange (INE) will allow Chinese buyers to lock in prices using local currency (RMB) and will also allow international traders to trade the contract too. Trading will launch January 18th 2018.

Full Text:

https://www.bloomberg.com/news/articles/2018-01-01/how-china-will-shake-up-the-oil-futures-market-quicktake-q-a


You can also find the exchange specs here:

Contract


I think this could be interesting if it grows to be of significance as a 3rd benchmark. I wonder what the arbitrage opportunities are like vs other medium sours such as Dubai/Oman?

Visit my NexusFi Trade Journal Reply With Quote
Thanked by:
  #2089 (permalink)
Batukhan
Helsinki
 
Posts: 1 since Nov 2014
Thanks Given: 1
Thanks Received: 0

I have a question regarded disaggregated COT reports on CL. I've always used it just as commercials non commercials, understanding commercials as producers hedging their production, (usually seeing it as when commercials are record short, oil should go down soon)
but if you look at the disagregated reports it seems there is a big difference between producers and swap dealers.
ATM it seems the producers are net neutral while swap dealers are record short.

can anybody shed some light on this topic?

thanks.

Reply With Quote
  #2090 (permalink)
 
SMCJB's Avatar
 SMCJB 
Houston TX
Legendary Market Wizard
 
Experience: Advanced
Platform: TT and Stellar
Broker: Advantage Futures
Trading: Primarily Energy but also a little Equities, Fixed Income, Metals and Crypto.
Frequency: Many times daily
Duration: Never
Posts: 5,049 since Dec 2013
Thanks Given: 4,388
Thanks Received: 10,207


@Batukhan swap dealers buy swaps from producers and then hedge the swap exposure with futures - hence they are nearly always short futures.

Also when looking at the COT reports you have to consider that there are other products that have the same or very similar risk profiles as futures, and as such the COT reports may not be as accurate as you might think.

Reply With Quote
Thanked by:


Last Updated on March 23, 2024


© 2024 NexusFi™, s.a., All Rights Reserved.
Av Ricardo J. Alfaro, Century Tower, Panama City, Panama, Ph: +507 833-9432 (Panama and Intl), +1 888-312-3001 (USA and Canada)
All information is for educational use only and is not investment advice. There is a substantial risk of loss in trading commodity futures, stocks, options and foreign exchange products. Past performance is not indicative of future results.
About Us - Contact Us - Site Rules, Acceptable Use, and Terms and Conditions - Privacy Policy - Downloads - Top
no new posts