|
Newcastle, Australia
Experience: Intermediate
Platform: Multicharts 8 - Full Version
Broker: IB
Trading: SPI,FTSE100, 6E, 6A
Posts: 285 since Oct 2010
Thanks Given: 108
Thanks Received: 188
|
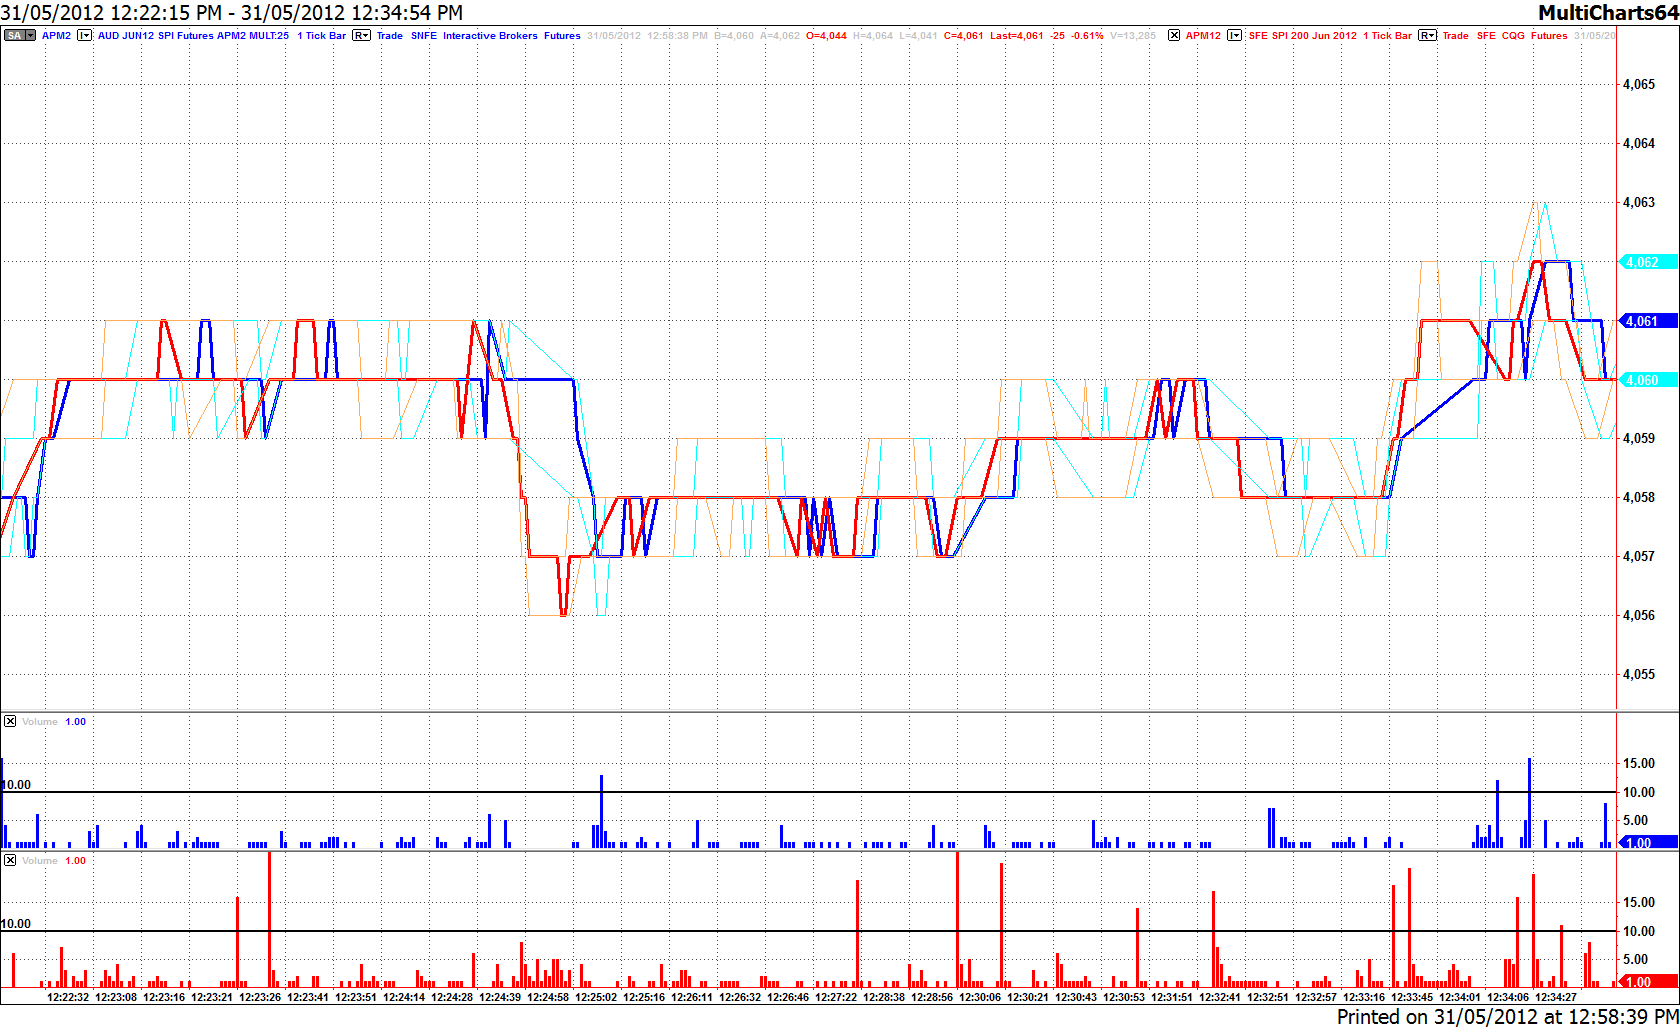
I thought I would share this 1 tick, tick chart with you.
The chart itself is the SPI futures contract and it is only traded on one exchange, SFE.
The Blue information is from IB ie Dark blue is the traded tick price and the light blue is the Bid&Ask.
The Red information is from CQG ie Dark red is the traded tick price and the light red is the Bid&Ask.
Same goes for the volume. Blue IB, Red CQG.
This is a live feed and all are plotted real time as they come in.
Notice how the red (CQG) always leads the blue (IB).
Sometimes the CQG price actually plots where the IB price didn't. This means that IB did not log this trade.
Also look at the volume difference.
|


