Welcome to NexusFi: the best trading community on the planet, with over 150,000 members Sign Up Now for Free
Genuine reviews from real traders, not fake reviews from stealth vendors
Quality education from leading professional traders
We are a friendly, helpful, and positive community
We do not tolerate rude behavior, trolling, or vendors advertising in posts
We are here to help, just let us know what you need
You'll need to register in order to view the content of the threads and start contributing to our community. It's free for basic access, or support us by becoming an Elite Member -- see if you qualify for a discount below.
-- Big Mike, Site Administrator
(If you already have an account, login at the top of the page)
Broker: Advantage Futures, Ninja/TT and InvestorRT/IQFeed.
Trading: Treasury futures
Posts: 312 since Nov 2010
Thanks Given: 194
Thanks Received: 912
3 yr, 10 yr, and 30 yr auctions this week. I expect market to be under pressure until Thursday or Friday. Short term lows often made on these auctions, especially the 3/10/30 auctions.
"You don't need a weatherman to know which way the wind blows..."
Broker: Advantage Futures, Ninja/TT and InvestorRT/IQFeed.
Trading: Treasury futures
Posts: 312 since Nov 2010
Thanks Given: 194
Thanks Received: 912
There was huge buying in ZN around the 120 01 to 120 005 level at a time when I would have expected to see mostly selling (pre-hedging). Maybe QE before the auction? Consistent with the strong auction results. We still have 30 yr. auction tomorrow.
"You don't need a weatherman to know which way the wind blows..."
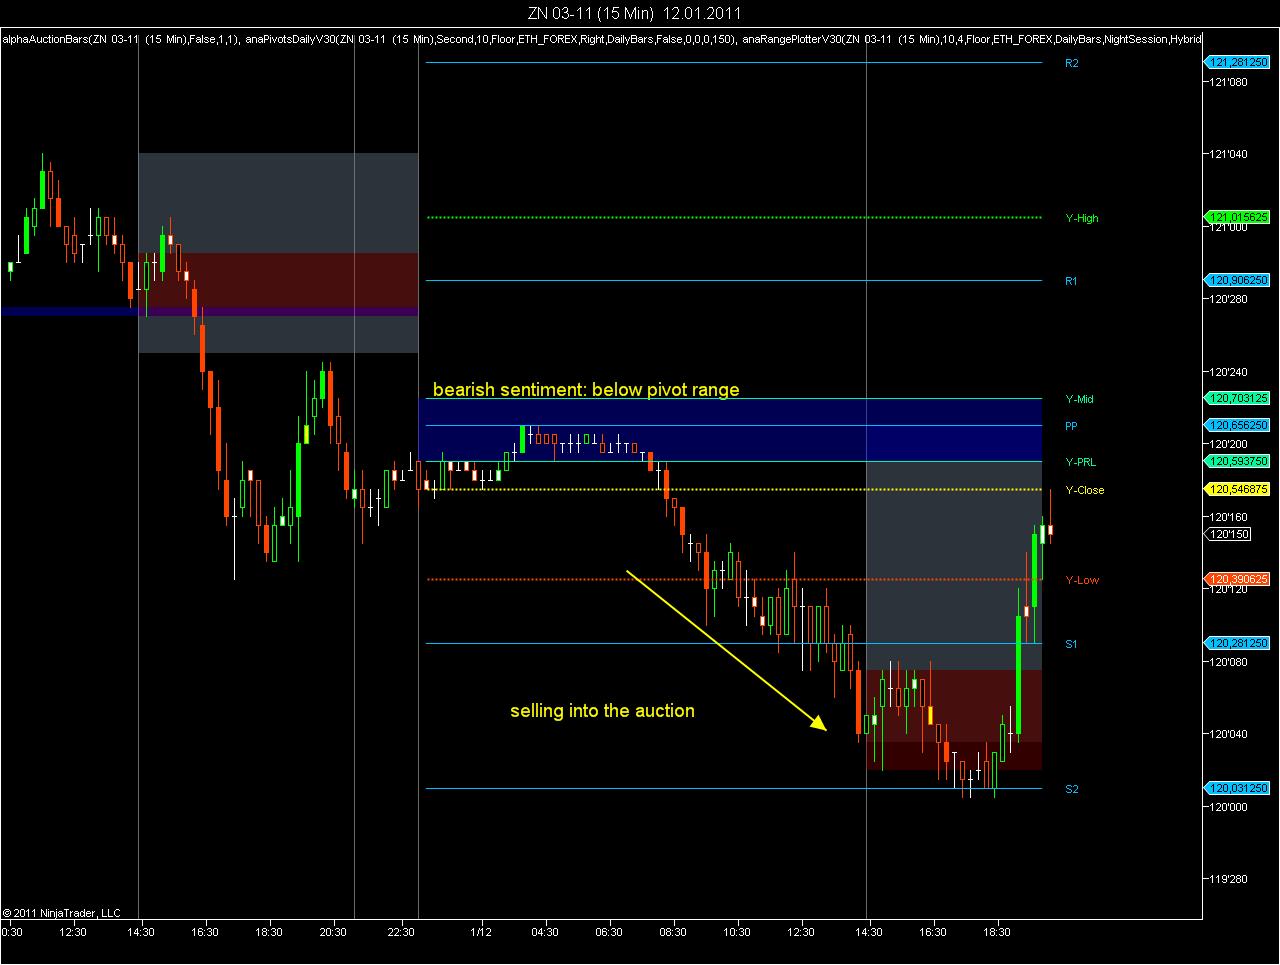
During the night session price stayed below the pivot PP. There was selling into the auction. The 120.03 level was the floor pivot S2, which usually is a terminus. Price is now retracing back to yesterday's close. Is this a breakout pullback?
I guess that the auction is supported by the market makers.
Broker: Advantage Futures, Ninja/TT and InvestorRT/IQFeed.
Trading: Treasury futures
Posts: 312 since Nov 2010
Thanks Given: 194
Thanks Received: 912
I may be the only floor trader who never used pivot points. Writing them on a blank trading card was too much like work :-). I'm probably the most successful totally unprepared trader in the history of the CBOT. I traded strictly on price action and tape-reading the underlying cash.
The trade around an auction is pretty straight forward. There is a known amount of supply entering the market at a known time. My understanding is that the primary dealers are committed to participate in the auction, both for their own accounts and on behalf of customers. Their sales force gets bids from customers which they submit to Treasury as well as their proprietary bids. This gives the dealers a feel for demand. They know they're going to be buying a lot of bonds, so they go into the auction short futures (they pre-hedge, just like grain elevators preparing for overnight grain purchases). Pre hedging in the massive quantities required for today's huge auctions drives down the market. IMO they come out of the auctions long, and let/force the market up to a more "average" level, where they unwind their inventories. I used to have a chart I had marked with auction dates of the previous couple of years, and especially where the 3/10/30 year auctions were concerned, there were noticeable dips during the early part of auction week, and noticeable rallies the last couple of days of that week. Usually the selling is particularly heavy in the hour before the auction, for obvious reasons.
Do not ever believe that the big dealers do not move the market where they need it to go. Early in my career I was skeptical about this. Then I spent a few months trading the basis (cash/futures spread) constantly on the phone with Cantor Fitzgerald and other cash brokers. One day one of the brokers mentioned that S. Korea was going to be in the market to price several billion of five year notes. Later that day FV futures were rallying, very strong relative to the rest of the Treasury complex, a slow grind up, but it was not led by cash. I was bullish because of the price action but I could not pull the trigger to get long because my trading was predicated on the cash market and the cash market didn't seem that strong. Suddenly hundreds and hundreds of millions of $ of cash five years flashed across the screen trading on the offer. Finally, I could get long, and did. Instantly the market dropped a half a point. The big cash trade was the pricing of the tender, (which I had forgotten about), the dealers had sold their inventory, and now they took the market down. An interesting lesson that I've never forgotten.
"You don't need a weatherman to know which way the wind blows..."
Price is hovering above the main pivot PP, so maybe they won't be unloading their inventory immediately, but only after today's auction.
(1) Do you have a source for all auction dates of the last two years? I could quickly write an indicator that displays the average price evolution during auction weeks for the dates selected.
(2) Do European, Japanese and Chinese auctions affect the market in a similar way?
The amount accepted was USD 21 billion. The bid-to-cover ratio was 3.30, but most of the tenders came from the primary dealers. If you look at the indirect bidders - I interpret this as foreign central banks and institutions -, they were allotted about USD 11 billion.
The median yield was 3.35%. How would you interpret the results�
Broker: Advantage Futures, Ninja/TT and InvestorRT/IQFeed.
Trading: Treasury futures
Posts: 312 since Nov 2010
Thanks Given: 194
Thanks Received: 912
The market went up solidly after the auction. IMO that is what is "supposed" to happen. See previous post about dealers moving the market where they need it to go. So results were as expected.
I am not connected enough to the process to take an analysis any farther than this.
"You don't need a weatherman to know which way the wind blows..."
Broker: Advantage Futures, Ninja/TT and InvestorRT/IQFeed.
Trading: Treasury futures
Posts: 312 since Nov 2010
Thanks Given: 194
Thanks Received: 912
Bid to cover was high. The fact that the dealers were aggressive suggests that they were very short going into the auction. Consistent w/ my speculation that Fed was buying a lot of Notes prior to the auction. But don't read too much into my analysis, it's only worth what you are paying for it.
"You don't need a weatherman to know which way the wind blows..."
I am not reading anything, yet. What I am looking for is an excel table with all auctions for bonds, 10-year-notes and 2-year notes between January 2008 and now, including
- auction date
- amount sold
- amount tendered
- bid-to-cover
- yield
Once I have this table, I can use it to do some analysis, how ZB and ZN behave during an auction week. Then look, when they behaved tyipcal and when they behaved in an unexpected way.
This is nothing more than a seasonal analysis for agricultures, just that the season analyzed is not several months, but several days long. If I can identify a specific pattern, I can use it as a filter to improve my entry and exit signals.
The data is more or less available on the Treasury's website, you can also subscibe to their feed an obtain the information via e-mail. But it is tedious to compile it.
Broker: Advantage Futures, Ninja/TT and InvestorRT/IQFeed.
Trading: Treasury futures
Posts: 312 since Nov 2010
Thanks Given: 194
Thanks Received: 912
Ok, but it will take awhile, and I'm trading now. I'll work on it this evening. On another topic, if you think floor pivots give good entry levels, I'll definitely take a look at them.
"You don't need a weatherman to know which way the wind blows..."