|
Point Roberts, WA, USA
Experience: Advanced
Platform: IB and free NT
Broker: IB
Trading: ES
Posts: 4,034 since Dec 2010
Thanks Given: 1,509
Thanks Received: 2,593
|
You might ask well if the instrument is at all time highs where is a resistance level?
Under these conditions (as it was for the ES in the chart I posted) the best you can do is use either:
1. a percentage of the last move
or
2. a swing average.
or
3. a vibrational number (this is a bit off-the wall so I won't go into this here.)
1. the last swing low in the es was 1922.75. It had fallen 32pts to there.
You add percentages of 32pts to the 1922.75 for your estimate of resistance levels
e.g
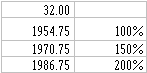
==>Notice how close the 150% is (1970.75 versus 1971.75)!!
2. Last 3 upswings of more than 30pts in the ES
41.75, 44.00, 95.75
average = 60.50
1922.75+60.50=1983
So in this case the swing average estimate (1983) doesn't apply as it is too far away from 1971.75 for 1 July 2014.
(However it could well be a good estimate for the upcoming top with the ES now at high of 1978.25, I'm also watching 1998)
I hope it helps!
..........
peace, love and joy to you
......... |
|


